Exam 20: Time-Series Analytics and Forecasting
Exam 1: What Is Statistics46 Questions
Exam 2: Graphical Descriptive Techniques 194 Questions
Exam 3: Graphical Descriptive Techniques 2156 Questions
Exam 4: Numerical Descriptive Techniques275 Questions
Exam 5: Data Collection and Sampling84 Questions
Exam 6: Probability240 Questions
Exam 7: Random Variables and Discrete Probability Distributions283 Questions
Exam 8: Continuous Probability Distributions224 Questions
Exam 9: Sampling Distributions156 Questions
Exam 10: Introduction to Estimation154 Questions
Exam 11: Introduction to Hypothesis Testing189 Questions
Exam 12: Inference About a Population153 Questions
Exam 13: Inference About Comparing Two Populations170 Questions
Exam 14: Analysis of Variance157 Questions
Exam 15: Chi-Squared Tests179 Questions
Exam 16: Simple Linear Regression and Correlation304 Questions
Exam 17: Multiple Regression160 Questions
Exam 18: Model Building148 Questions
Exam 19: Nonparametric Statistics175 Questions
Exam 20: Time-Series Analytics and Forecasting225 Questions
Exam 21: Statistical Process Control140 Questions
Exam 22: Decision Analysis123 Questions
Exam 23: Conclusion47 Questions
Select questions type
It must be understood that the ____________________ of a forecast decreases rapidly for predictions more than one time period into the future.
(Short Answer)
4.8/5  (27)
(27)
The Pyramids of Giza
The Pyramids of Giza is one of the most visited monuments in Egypt.The number of visitors per quarter has been recorded (in thousands)as shown in the accompanying table: 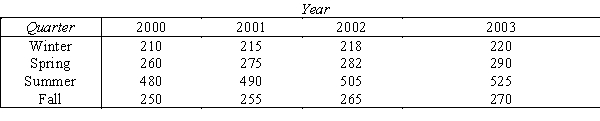
-{The Pyramids of Giza Narrative} Use the seasonal indexes and the linear trend calculated in the previous questions to forecast the number of visitors in the next four quarters and describe the seasonal fluctuations in the number of visitors.
-{The Pyramids of Giza Narrative} Use the seasonal indexes and the linear trend calculated in the previous questions to forecast the number of visitors in the next four quarters and describe the seasonal fluctuations in the number of visitors.
(Essay)
4.9/5 (42)
A time series is shown in the table below. 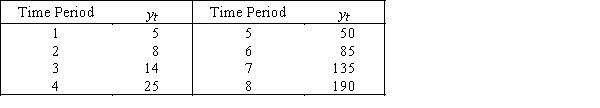 a.Plot the time series.Would the linear or quadratic model fit better?
b.Use the regression technique to calculate the linear trend line and the quadratic trend line.Which model fits better?
a.Plot the time series.Would the linear or quadratic model fit better?
b.Use the regression technique to calculate the linear trend line and the quadratic trend line.Which model fits better?
(Essay)
4.9/5 (36)
Two forecasting models were used to predict the future values of a time series.These are shown in the accompanying table,together with the actual values. 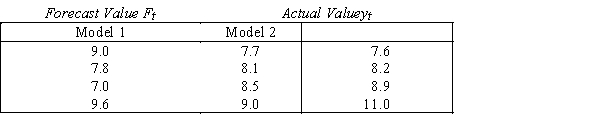 Compute the mean absolute deviation (MAD)and sum of squares for forecast (SSE)for each model to determine which was more accurate.
(Essay)
4.8/5 (29)
The quarterly earnings of a large microcomputer company have been recorded for the years 2011-2014.These data (in millions of dollars)are shown in the accompanying table. 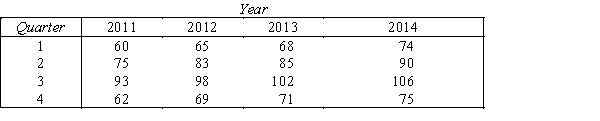 Use an appropriate moving average to measure the quarterly variation by computing the seasonal (quarterly)indexes.
(Essay)
4.9/5 (21)
A least squares ____________________ trend line is just a simple regression line with the years recoded.
(Short Answer)
4.9/5 (38)
The following are the values of a time series for the first four time periods:  Using a four-period moving average,the forecasted value for time period 5 is:
(Multiple Choice)
5.0/5 (43)
The Pyramids of Giza
The Pyramids of Giza is one of the most visited monuments in Egypt.The number of visitors per quarter has been recorded (in thousands)as shown in the accompanying table:
-{The Pyramids of Giza Narrative} Discuss why exponential smoothing is not recommended as a forecasting method in this case.
(Essay)
4.8/5 (35)
The results of a quadratic model fit to time series data were  = 8.5 − 0.25t + 2.5t2,where t = 1 for 1998.The forecasted value for 2005 is 129.25.
(True/False)
5.0/5 (28)
If a time series does not exhibit a long-term trend,the method of exponential smoothing may be used to obtain short-term predictions about the future.
(True/False)
4.8/5 (28)
The equation: St = w⋅yt + (1 −w)⋅St− 1 (for t≥ 2)refers to exponentially smoothed time series.
(True/False)
4.9/5 (32)
Daily Hoagie Sales
The table below shows the number of hoagies sold daily during a four-week period at Hoagie Haven in Sutton,West Virginia. 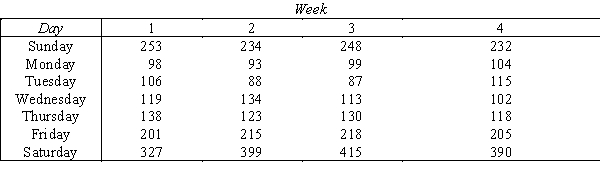
-{Daily Hoagie Sales Narrative} Calculate the seasonal (daily)indexes,using a seven-day moving average.
-{Daily Hoagie Sales Narrative} Calculate the seasonal (daily)indexes,using a seven-day moving average.
(Essay)
4.9/5 (31)
Daily Sandwich Sales
The daily sales figures shown below have been recorded in a sandwich shop. 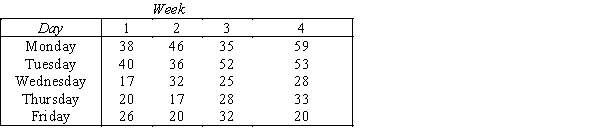
-{Daily Sandwich Sales Narrative} Compute the three-day and five-day moving averages.
-{Daily Sandwich Sales Narrative} Compute the three-day and five-day moving averages.
(Essay)
4.8/5 (30)
Liquor Sales
The number of cases of liquor sold by a liquor wholesaler in an 8-year period follows. 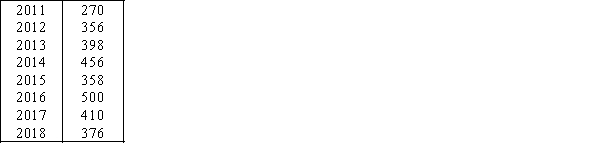
-{Liquor Sales Narrative} Exponential smoothing with a weight or smoothing constant of 0.2 will be used to smooth the liquor sales.The smoothed value for 2012 is_________________.
-{Liquor Sales Narrative} Exponential smoothing with a weight or smoothing constant of 0.2 will be used to smooth the liquor sales.The smoothed value for 2012 is_________________.
(Short Answer)
4.8/5 (37)
Weekly iPhones sales (in $1,000s)in an Apple store for the past three months are shown in the table below.Compute the four-week centered moving averages. 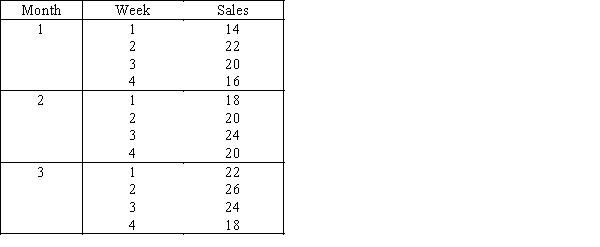
(Essay)
4.8/5 (45)
Hotel Occupancy
A small hotel has recorded the number of rooms occupied during weekdays over a period of four weeks as is shown in the table below: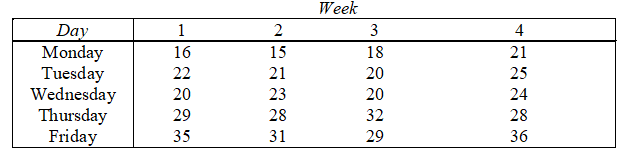 -{Hotel Occupancy Narrative} Calculate the seasonal indexes,based on the regression trend line developed in the previous question.
(Essay)
4.9/5 (32)
Forecasts based on trend and seasonality are generated by:
(Multiple Choice)
4.9/5 (34)
Biodiesel Sales Biodiesel
(a vegetable oil or animal fat based diesel fuel)sales in Nebraska have been recorded over the past 10 months as shown below. 
-{Biodiesel Sales Narrative} Compute the five-month moving average.
-{Biodiesel Sales Narrative} Compute the five-month moving average.
(Essay)
4.8/5 (33)
Coffee Imports
The coffee imports (in millions of dollars)from a Latin American country for 10 years are shown below. 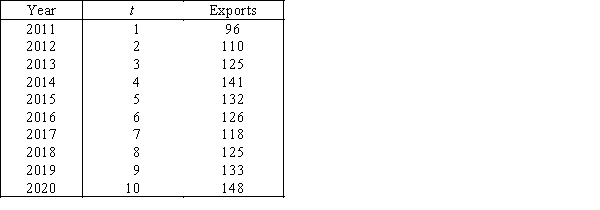
-{Coffee Imports Narrative} Calculate the percentage of trend.
-{Coffee Imports Narrative} Calculate the percentage of trend.
(Essay)
4.8/5 (39)
The trend line  = 125 + 2t and seasonal indexes shown in the table below were computed from 10 years of quarterly data.Forecast the values for the next four quarters.
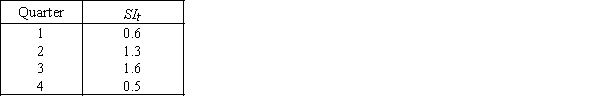
(Essay)
4.8/5 (30)
Filters
- Essay(0)
- Multiple Choice(0)
- Short Answer(0)
- True False(0)
- Matching(0)