Exam 20: Time-Series Analytics and Forecasting
Exam 1: What Is Statistics46 Questions
Exam 2: Graphical Descriptive Techniques 194 Questions
Exam 3: Graphical Descriptive Techniques 2156 Questions
Exam 4: Numerical Descriptive Techniques275 Questions
Exam 5: Data Collection and Sampling84 Questions
Exam 6: Probability240 Questions
Exam 7: Random Variables and Discrete Probability Distributions283 Questions
Exam 8: Continuous Probability Distributions224 Questions
Exam 9: Sampling Distributions156 Questions
Exam 10: Introduction to Estimation154 Questions
Exam 11: Introduction to Hypothesis Testing189 Questions
Exam 12: Inference About a Population153 Questions
Exam 13: Inference About Comparing Two Populations170 Questions
Exam 14: Analysis of Variance157 Questions
Exam 15: Chi-Squared Tests179 Questions
Exam 16: Simple Linear Regression and Correlation304 Questions
Exam 17: Multiple Regression160 Questions
Exam 18: Model Building148 Questions
Exam 19: Nonparametric Statistics175 Questions
Exam 20: Time-Series Analytics and Forecasting225 Questions
Exam 21: Statistical Process Control140 Questions
Exam 22: Decision Analysis123 Questions
Exam 23: Conclusion47 Questions
Select questions type
If the time series is composed of seasonal variation and long-term trend,we can use seasonal indexes and the regression equation to forecast.
(True/False)
4.8/5  (41)
(41)
A least squares linear trend line is just a simple regression line with the years recoded.
(True/False)
4.8/5 (41)
In time series regressions the seasonal variation may occur within a year or within shorter intervals,such as a month,
week,or day.
(True/False)
4.8/5 (33)
In determining monthly seasonal indexes for gas consumption,the sum of the 12 means for gas consumption as a percentage of the moving average is 1150.To get the seasonal indexes,each of the 12 monthly means is to be multiplied by:
(Multiple Choice)
4.9/5 (30)
The most commonly used measures of forecast accuracy are ____________________ and the sum of squares for forecast errors (SSE).
(Short Answer)
4.8/5 (37)
Holiday Hours
The total holiday hours (in 1000s)were recorded for 16 quarters in a large steel mill as shown below. 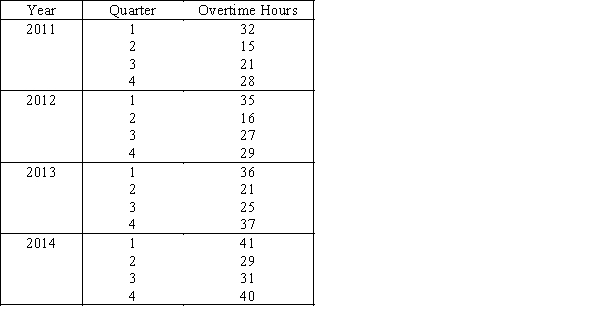
-{Holiday Hours Narrative} Use the regression technique to calculate the linear trend line.
-{Holiday Hours Narrative} Use the regression technique to calculate the linear trend line.
(Essay)
4.9/5 (35)
Which of the following statements about moving averages is not true?
(Multiple Choice)
4.8/5 (37)
A local newspaper that appears six days per week wanted to forecast two-day revenues from its business services classified ads section.The revenues (in $1,000s)were recorded for the past 52 weeks.From these data,the following regression equation was computed:  = 2000 + 0.6t− 150D1− 40D2 (t = 1,2,3,...,156)
where
= 2000 + 0.6t− 150D1− 40D2 (t = 1,2,3,...,156)
where 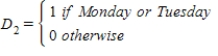 and
and 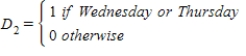 Forecast the two-day revenues for the next week.
(Essay)
4.7/5 (24)
The term b1 in the equation  = b0 + b1t + b2Q1 + b3Q2 +b4Q3,where
  represents the predicted value of y at time t,is:
(Multiple Choice)
4.8/5 (33)
An estimated second-order autoregressive model for average mortgage rate is: 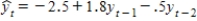 .If the average mortgage rate in 2003 was 7.0,and in 2002 was 6.5,the forecast for 2004 is ____________________,and for 2005 is ____________________.
(Short Answer)
4.9/5 (34)
Microprocessors
Annual production (in millions)of computer microprocessors in a large electronics company was recorded as shown below 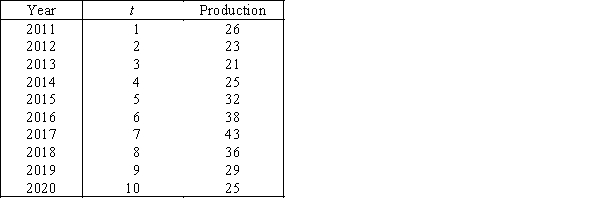
-{Microprocessors Narrative} Describe the cyclical effect (if there is one).
-{Microprocessors Narrative} Describe the cyclical effect (if there is one).
(Essay)
4.8/5 (32)
Cyclical variation,one of the four different components of a time series,is more likely to exhibit business cycles that record periods of economic recession and inflation.
(True/False)
4.8/5 (47)
If we want to measure the seasonal variations on stock market performance by quarter,we would need:
(Multiple Choice)
4.7/5 (23)
In determining weekly seasonal indexes for gas consumption,the sum of the 52 means for gas consumption as a percentage of the moving average is 5050.To get the seasonal indexes,each weekly mean is to be multiplied by:
(Multiple Choice)
4.9/5 (28)
The actual and forecast values of a time series are shown below. 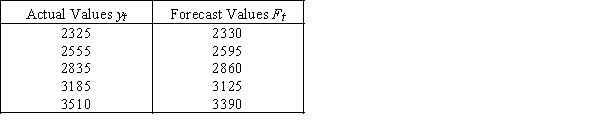 a.Calculate the mean absolute deviation (MAD).
b.Calculate the sum of squares for forecast error (SSE)
a.Calculate the mean absolute deviation (MAD).
b.Calculate the sum of squares for forecast error (SSE)
(Essay)
4.7/5 (28)
The easiest way of measuring the long-term trend is by regression analysis,where time is the ____________________ variable.
(Short Answer)
4.8/5 (32)
The following are the values of a time series for the first four time periods:  Using exponential smoothing,with w = 0.30,the forecasted value for time period 5 is:
(Multiple Choice)
4.7/5 (27)
The overall upward or downward pattern of the data in an annual time series will be contained in which component of the time series?
(Multiple Choice)
4.8/5 (40)
The model yt = Tt + Ct + St + Rt + εt that assumes the time series value at time t is the sum of the four time series components Tt,Ct,St,and Rt is referred to as:
(Multiple Choice)
4.8/5 (29)
Filters
- Essay(0)
- Multiple Choice(0)
- Short Answer(0)
- True False(0)
- Matching(0)