Exam 20: Time-Series Analytics and Forecasting
Exam 1: What Is Statistics46 Questions
Exam 2: Graphical Descriptive Techniques 194 Questions
Exam 3: Graphical Descriptive Techniques 2156 Questions
Exam 4: Numerical Descriptive Techniques275 Questions
Exam 5: Data Collection and Sampling84 Questions
Exam 6: Probability240 Questions
Exam 7: Random Variables and Discrete Probability Distributions283 Questions
Exam 8: Continuous Probability Distributions224 Questions
Exam 9: Sampling Distributions156 Questions
Exam 10: Introduction to Estimation154 Questions
Exam 11: Introduction to Hypothesis Testing189 Questions
Exam 12: Inference About a Population153 Questions
Exam 13: Inference About Comparing Two Populations170 Questions
Exam 14: Analysis of Variance157 Questions
Exam 15: Chi-Squared Tests179 Questions
Exam 16: Simple Linear Regression and Correlation304 Questions
Exam 17: Multiple Regression160 Questions
Exam 18: Model Building148 Questions
Exam 19: Nonparametric Statistics175 Questions
Exam 20: Time-Series Analytics and Forecasting225 Questions
Exam 21: Statistical Process Control140 Questions
Exam 22: Decision Analysis123 Questions
Exam 23: Conclusion47 Questions
Select questions type
Mattress Sales
Monthly mattress sales (in $1,000s)of a mattress store are shown below. 
-{Monthly Mattress Sales Narrative} Calculate the four-month moving average,and four-month centered moving average.
-{Monthly Mattress Sales Narrative} Calculate the four-month moving average,and four-month centered moving average.
(Essay)
4.7/5  (35)
(35)
Given a data set with 15 yearly observations,there are only seven 9-year moving averages.
(True/False)
4.9/5 (34)
The trend line and seasonal indexes shown below were computed from four weeks of daily observations.Forecast the seven values for the next week.
Trend Line:  = 145 + 1.66t (t = 1,2,3,...28)
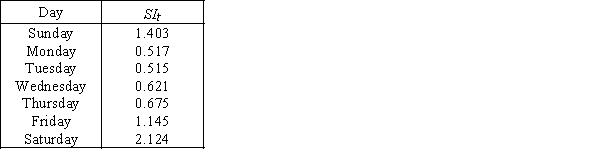
(Essay)
4.9/5 (29)
The most commonly used measures of forecast accuracy are mean absolute deviation (MAD)and the ____________________.
(Short Answer)
4.9/5 (35)
Motor Oil Sales
As part of an effort to forecast future sales,the monthly motor oil sales (in thousands of gallons)for the past 10 months are recorded.These data are shown below. 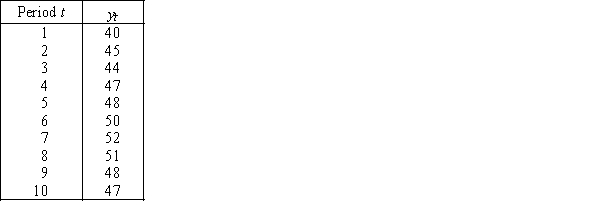
-The trend line
-The trend line  = 0.75 + 0.005t was calculated from quarterly data for 2000-2004,where t = 1 for the first quarter of 2000.The trend value for the second quarter of the year 2005 is 0.86.
(True/False)
4.8/5 (40)
If there is no obvious trend or seasonality and we believe that there is a correlation between consecutive residuals,the ____________________ model may be most effective.
(Short Answer)
4.9/5 (29)
Which method would you recommend to your statistics professor in selecting the appropriate forecasting model if avoiding large errors is extremely important to him or her?
(Multiple Choice)
4.9/5 (35)
Daily Sandwich Sales
The daily sales figures shown below have been recorded in a sandwich shop. 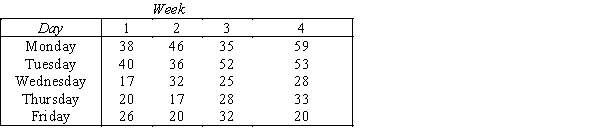
-{Daily Sandwich Sales Narrative} Does there appear to be a seasonal (weekly)pattern?
-{Daily Sandwich Sales Narrative} Does there appear to be a seasonal (weekly)pattern?
(Essay)
4.8/5 (39)
The most commonly used measures of forecast accuracy are the mean absolute deviation (MAD)and the sum of squares for forecast error (SSE).
(True/False)
4.9/5 (35)
To measure the seasonal variation,we compute seasonal indexes,which gauge the degree to which the seasons differ from one another.
(True/False)
4.8/5 (33)
Which of the following statements about the method of exponential smoothing is not true?
(Multiple Choice)
4.8/5 (37)
A time series is shown in the table below: 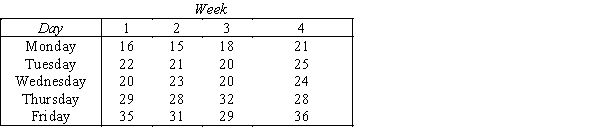 Compute the five-day moving averages to remove the seasonal and random variation.
(Essay)
4.8/5 (41)
Which of the four-time series component is more likely to exhibit the changes in stock market prices at particular times during the course of one day?
(Multiple Choice)
4.7/5 (39)
Photo Equipment Store Earnings
The quarterly earnings of a chain of Photo Equipment stores have been recorded for the years 2011-2014.These data (in millions of dollars)are shown in the accompanying table. 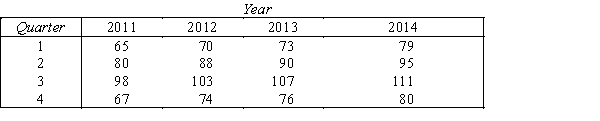
-{Photo Equipment Store Earnings Narrative} Forecast the quarterly earnings for the years 2015 and 2016.
-{Photo Equipment Store Earnings Narrative} Forecast the quarterly earnings for the years 2015 and 2016.
(Essay)
4.8/5 (34)
The number of four-period centered moving averages of a time series with 20 time periods is:
(Multiple Choice)
4.7/5 (33)
Which of the following equations deseasonalize a time series,where T,C,S,and R are respectively the trend,cyclical,seasonal,and random variation components of the time series?
(Multiple Choice)
4.8/5 (45)
After estimating a trend model for annual time-series data,you obtain the following residual plot against time. 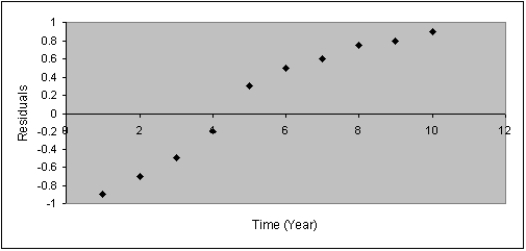 The problem with your model is that:
(Multiple Choice)
4.8/5 (34)
We compute the five-period moving averages for all time periods except the first two and last two time periods.
(True/False)
4.8/5 (27)
A time series for the years 2011-2016 is shown below. 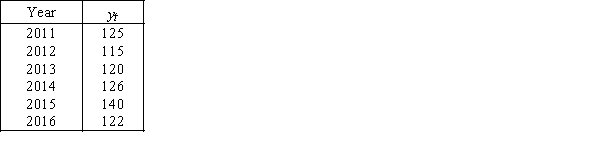 Develop forecasts for the years 2002-2004,with the following smoothing constant values: w = 0.2,w = 0.5,and w = 0.6.
(Essay)
4.7/5 (25)
Hotel Occupancy
A small hotel has recorded the number of rooms occupied during weekdays over a period of four weeks as is shown in the table below: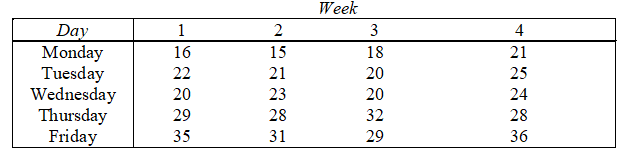 -{Hotel Occupancy Narrative} Calculate the seasonal (daily)indexes.
(Essay)
4.8/5 (23)
Filters
- Essay(0)
- Multiple Choice(0)
- Short Answer(0)
- True False(0)
- Matching(0)