Exam 18: Time Series and Forecasting
Exam 1: What Is Statistics83 Questions
Exam 2: Describing Data: Frequency Tables, Frequency Distributions, and Graphic Presentation132 Questions
Exam 3: Describing Data: Numerical Measures124 Questions
Exam 4: Describing Data: Displaying and Exploring Data113 Questions
Exam 5: A Survey of Probability Concepts134 Questions
Exam 6: Discrete Probability Distributions131 Questions
Exam 7: Continuous Probability Distributions135 Questions
Exam 8: Sampling Methods and the Central Limit Theorem117 Questions
Exam 9: Estimation and Confidence Intervals131 Questions
Exam 10: One-Sample Tests of Hypothesis110 Questions
Exam 11: Two-Sample Tests of Hypothesis98 Questions
Exam 12: Analysis of Variance134 Questions
Exam 13: Correlation and Linear Regression138 Questions
Exam 14: Multiple Regression Analysis135 Questions
Exam 15: Nonparametric Methods: Nominal Level Hypothesis Tests181 Questions
Exam 16: Nonparametric Methods: Analysis of Ordinal Data138 Questions
Exam 17: Index Numbers137 Questions
Exam 18: Time Series and Forecasting139 Questions
Exam 19: Statistical Process Control and Quality Management136 Questions
Exam 20: An Introduction to Decision Theory115 Questions
Select questions type
To calculate monthly typical seasonal indexes, how many periods are included in the ratio-to-moving-average method?
(Multiple Choice)
4.7/5  (30)
(30)
The Durbin-Watson statistic is used to analyze ___________.
(Multiple Choice)
4.9/5 (37)
For a straight trend line, ______________ represents the amount of change in Ŷ for each increase of one unit in t.
(Short Answer)
4.9/5 (41)
For an annual time series extending from 2000 through 2010, how many years would be lost in a three-year moving average?
(Multiple Choice)
4.7/5 (42)
The merchants in Dallas, Texas, suffered flood damage in May 2003. Stores were closed for remodeling nearly two months. What is this type of variation in sales called?
(Multiple Choice)
4.9/5 (33)
To calculate monthly typical seasonal indexes, after computing the ratio-to-moving averages, the averages must be:
(Multiple Choice)
4.7/5 (34)
A useful method for smoothing a time series to examine a trend is called a ______.
(Short Answer)
4.9/5 (39)
A _____________ transformation should be used for a time series that increases by equal percentages over time.
(Short Answer)
4.9/5 (39)
Product sales since 1999 are:  The least squares trend equation is given as:
Ŷ = 265.12 - 21.18t, where t is set equal to 1 for 1999.
On average, how much did sales change per year from 1999 to 2007?
The least squares trend equation is given as:
Ŷ = 265.12 - 21.18t, where t is set equal to 1 for 1999.
On average, how much did sales change per year from 1999 to 2007?
(Essay)
4.7/5 (32)
What is the general equation for the logarithmic trend equation to forecast Ŷ?
(Multiple Choice)
4.8/5 (45)
What is the logarithmic transformation for the equation Ŷ = a + bt?
(Multiple Choice)
4.8/5 (35)
The following table shows the sales for a resort hotel recorded over the past year. The seasonal indexes for each quarter are also provided. To track the trend for these four quarters, use the indexes to deseasonalize the sales data. 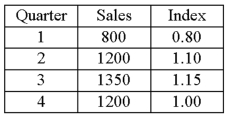
(Essay)
4.8/5 (41)
For the third quarter, the sales are 1,500 units; the seasonal index for the quarter is 1.15. What are the deseasonalized sales for the quarter?
(Multiple Choice)
4.8/5 (36)
A graph of a deseasonalized time series does NOT show ________.
(Short Answer)
4.9/5 (36)
Which of the following components is not present in a time series?
(Multiple Choice)
4.9/5 (33)
To calculate monthly typical seasonal indexes, a specific seasonal index must be computed for:
(Multiple Choice)
4.8/5 (40)
Since a ski resort does most of its business in the winter, what is the major source of variation that affects sales?
(Multiple Choice)
4.9/5 (40)
For the third quarter, the sales are 2,000 units; the seasonal index for the quarter is 1.15. What are the deseasonalized sales for the quarter?
(Multiple Choice)
4.8/5 (36)
The following linear trend equation was developed for annual sales from 2005 to 2009, with 2005 as the base year. Ŷ = 500 + 60t (in $thousands). What are the estimated sales for 2010 (in $thousands)?
(Multiple Choice)
4.9/5 (38)
Filters
- Essay(0)
- Multiple Choice(0)
- Short Answer(0)
- True False(0)
- Matching(0)