Exam 18: Time Series and Forecasting
Exam 1: What Is Statistics83 Questions
Exam 2: Describing Data: Frequency Tables, Frequency Distributions, and Graphic Presentation132 Questions
Exam 3: Describing Data: Numerical Measures124 Questions
Exam 4: Describing Data: Displaying and Exploring Data113 Questions
Exam 5: A Survey of Probability Concepts134 Questions
Exam 6: Discrete Probability Distributions131 Questions
Exam 7: Continuous Probability Distributions135 Questions
Exam 8: Sampling Methods and the Central Limit Theorem117 Questions
Exam 9: Estimation and Confidence Intervals131 Questions
Exam 10: One-Sample Tests of Hypothesis110 Questions
Exam 11: Two-Sample Tests of Hypothesis98 Questions
Exam 12: Analysis of Variance134 Questions
Exam 13: Correlation and Linear Regression138 Questions
Exam 14: Multiple Regression Analysis135 Questions
Exam 15: Nonparametric Methods: Nominal Level Hypothesis Tests181 Questions
Exam 16: Nonparametric Methods: Analysis of Ordinal Data138 Questions
Exam 17: Index Numbers137 Questions
Exam 18: Time Series and Forecasting139 Questions
Exam 19: Statistical Process Control and Quality Management136 Questions
Exam 20: An Introduction to Decision Theory115 Questions
Select questions type
A typical seasonal index of 103.7 for January indicates that sales for January are below the annual average.
(True/False)
4.8/5  (33)
(33)
A ______________ analysis predicts the future on the basis of past data.
(Short Answer)
4.8/5 (37)
Knowing the seasonal pattern in the form of indexes allows the retailer to deseasonalize sales. This is accomplished by dividing the actual sales for a month by the typical index for that month.
(True/False)
4.9/5 (34)
A plastics manufacturer performed a quarterly time series analysis for demands over the last five years (periods 1 through 20). The analysis resulted in the following trend equation and seasonal indexes:  = 920.0 + 22.6t
 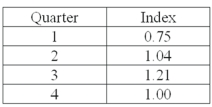 Based on the seasonal indexes, which quarter is expected to have 21% more demand than predicted by the trend line?
(Essay)
4.7/5 (40)
Product sales since 2001 are: 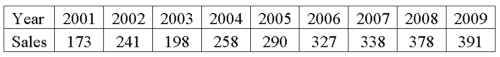 The least squares trend equation is given as:
Ŷ = 100 + 28t, where t is set equal to 1 for 2001.
What were the predicted sales in 2006?
The least squares trend equation is given as:
Ŷ = 100 + 28t, where t is set equal to 1 for 2001.
What were the predicted sales in 2006?
(Essay)
4.8/5 (34)
What is the long-term behavior of a variable over an extended period of time called?
(Multiple Choice)
4.7/5 (30)
For the third quarter, the sales are 2,500 units; the seasonal index for the quarter is 0.95. What are the deseasonalized sales for the quarter?
(Multiple Choice)
4.9/5 (34)
Product sales since 2001 are: 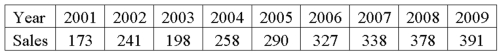 The least squares trend equation is given as:
Ŷ = 100 + 28t, where t is set equal to 1 for 2001.
What is the three-year moving average for 2007 to 2009?
The least squares trend equation is given as:
Ŷ = 100 + 28t, where t is set equal to 1 for 2001.
What is the three-year moving average for 2007 to 2009?
(Essay)
4.8/5 (40)
If the exports (in $millions) for the period 2006 through 2010 were $878, $892, $864, $870, and $912, respectively, what are these values called?
(Multiple Choice)
4.8/5 (46)
A resort hotel performed a quarterly time series analysis for demands over the last five years (periods 1 through 20). The analysis resulted in the following trend equation and seasonal indexes:
Ŷ = 1000 + 150t 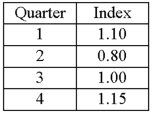 The seasonal indexes have ______________.
(Essay)
4.7/5 (41)
For the third quarter, the sales are 2,500 units; the seasonal index for the quarter is 1.20. What are the deseasonalized sales for the quarter?
(Multiple Choice)
4.9/5 (31)
One component of a time series is cyclical variation. An example of cyclical variation is the business cycle that consists of periods of prosperity followed by periods of recession, depression, and recovery.
(True/False)
4.7/5 (38)
The ________________ method is used to determine the linear equation when the best fitting straight line is required.
(Short Answer)
4.8/5 (34)
To calculate monthly typical seasonal indexes, the specific seasonal indexes must be averaged for:
(Multiple Choice)
4.8/5 (42)
To study the trend and cycle components of a time series, typical seasonal indexes are used to compute ___________.
(Short Answer)
4.9/5 (37)
The moving average method smoothes out the fluctuations in the data.
(True/False)
4.9/5 (42)
Given the following trend equation based on five years of annual sales (in millions of dollars), beginning in 2005: Ŷ = 4.53 + 1.54t
The estimated value for 2008 is ______.
(Multiple Choice)
4.9/5 (38)
If the trend equation is Ŷ = 10 + 100t, the forecasted value increases 100 units for the next time period, t.
(True/False)
4.8/5 (33)
A resort hotel performed a quarterly time series analysis for demands over the last five years (periods 1 through 20). The analysis resulted in the following trend equation and seasonal indexes:
Ŷ = 1000 + 150t  Based on the seasonal indexes, which quarter is expected to have 15% more demand than predicted by the trend line?
(Essay)
4.9/5 (31)
For quarterly seasonal indexes, the total of the adjusted quarterly indexes will equal _____.
(Multiple Choice)
4.9/5 (38)
Filters
- Essay(0)
- Multiple Choice(0)
- Short Answer(0)
- True False(0)
- Matching(0)