Exam 18: Time Series and Forecasting
Exam 1: What Is Statistics83 Questions
Exam 2: Describing Data: Frequency Tables, Frequency Distributions, and Graphic Presentation132 Questions
Exam 3: Describing Data: Numerical Measures124 Questions
Exam 4: Describing Data: Displaying and Exploring Data113 Questions
Exam 5: A Survey of Probability Concepts134 Questions
Exam 6: Discrete Probability Distributions131 Questions
Exam 7: Continuous Probability Distributions135 Questions
Exam 8: Sampling Methods and the Central Limit Theorem117 Questions
Exam 9: Estimation and Confidence Intervals131 Questions
Exam 10: One-Sample Tests of Hypothesis110 Questions
Exam 11: Two-Sample Tests of Hypothesis98 Questions
Exam 12: Analysis of Variance134 Questions
Exam 13: Correlation and Linear Regression138 Questions
Exam 14: Multiple Regression Analysis135 Questions
Exam 15: Nonparametric Methods: Nominal Level Hypothesis Tests181 Questions
Exam 16: Nonparametric Methods: Analysis of Ordinal Data138 Questions
Exam 17: Index Numbers137 Questions
Exam 18: Time Series and Forecasting139 Questions
Exam 19: Statistical Process Control and Quality Management136 Questions
Exam 20: An Introduction to Decision Theory115 Questions
Select questions type
When a time series is non-linear, suggest a method for transforming the data so that the least squares method can be applied.
(Essay)
4.9/5  (34)
(34)
In the final step, using the ratio-to-moving-average method, the total of the 12 modified means should theoretically be equal to 1,200 because the average of the 12 months is designated as 100.
(True/False)
4.7/5 (36)
Given the trend equation, Ŷ = 25 + 0.6t (base year = 2006), what would be the forecast value for 2010?
(Multiple Choice)
4.8/5 (40)
Product sales since 1999 are:  The least squares trend equation is given as:
Ŷ = 265.12 - 21.18t, where t is set equal to 1 for 1999.
What were the predicted sales in 2006?
The least squares trend equation is given as:
Ŷ = 265.12 - 21.18t, where t is set equal to 1 for 1999.
What were the predicted sales in 2006?
(Essay)
4.8/5 (41)
If the time series trend is non-linear, a transformation of the data is required.
(True/False)
4.7/5 (41)
Data that increases by equal percentages over a period of time appears as a ____________ on an arithmetic scaled graph.
(Short Answer)
5.0/5 (32)
When estimating the specific seasonals for a monthly time series, the sum of the 12 modified means should theoretically be equal to 1,200 because the average of the 12 specific seasonals is designated as 100.
(True/False)
4.7/5 (34)
The following linear trend equation was developed for the annual sales of the Jordan Manufacturing Company. Ŷ = 500 + 60t (in $thousands). At what rate are sales increasing?
(Multiple Choice)
4.8/5 (41)
To compute a forecast for a time series with seasonality, the trended forecast is computed and then adjusted by multiplying by a ________.
(Short Answer)
4.8/5 (39)
If a major hurricane exerts an impact on the economy, that event could be classified as a(n) ___________.
(Multiple Choice)
4.8/5 (39)
The following trend equation is for a manufacturer of women's purses (in millions of purses) based on six years of quarterly data. Ŷ = 2.15 + 1.32t
The following table provides the seasonal factors for each quarter. 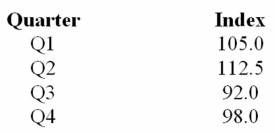 The seasonally adjusted forecast for the second quarter of the fifth year is _______.
(Multiple Choice)
4.9/5 (31)
The trend forecast equation is Ŷ = 50 + 420t. The next forecast is for period 10. The typical seasonal index for period 10 is 1.25. What are the forecast sales for period 10?
(Multiple Choice)
4.9/5 (35)
A logarithmic trend equation should be used when the time series trend is __________________.
(Multiple Choice)
4.8/5 (41)
The following table shows the sales for a plastics manufacturer recorded over the past year. The seasonal indexes for each quarter are also provided. To track the trend for these four quarters, use the indexes to deseasonalize the sales data. 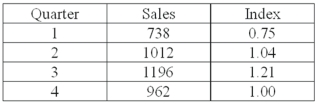 Overall, sales are ___________.
(Essay)
4.9/5 (41)
The trend forecast equation is Ŷ = 50 + 420t. The next forecast is for period 10. The typical seasonal index for period 10 is 0.82. What are the forecast sales for period 10?
(Multiple Choice)
4.7/5 (38)
To calculate monthly typical seasonal indexes, after computing the ratio-to-moving averages, the averages must be:
(Multiple Choice)
4.8/5 (39)
For a five-year moving average, how many values will be lost at the beginning and end of the time series?
(Multiple Choice)
4.8/5 (44)
What time series component was exemplified during the 1980s when the American economy enjoyed a period of prosperity?
(Multiple Choice)
4.8/5 (37)
For the third quarter, the sales are 2,000 units; the seasonal index for the quarter is 0.80. What are the deseasonalized sales for the quarter?
(Multiple Choice)
4.9/5 (31)
Filters
- Essay(0)
- Multiple Choice(0)
- Short Answer(0)
- True False(0)
- Matching(0)