Exam 18: Time Series and Forecasting
Exam 1: What Is Statistics83 Questions
Exam 2: Describing Data: Frequency Tables, Frequency Distributions, and Graphic Presentation132 Questions
Exam 3: Describing Data: Numerical Measures124 Questions
Exam 4: Describing Data: Displaying and Exploring Data113 Questions
Exam 5: A Survey of Probability Concepts134 Questions
Exam 6: Discrete Probability Distributions131 Questions
Exam 7: Continuous Probability Distributions135 Questions
Exam 8: Sampling Methods and the Central Limit Theorem117 Questions
Exam 9: Estimation and Confidence Intervals131 Questions
Exam 10: One-Sample Tests of Hypothesis110 Questions
Exam 11: Two-Sample Tests of Hypothesis98 Questions
Exam 12: Analysis of Variance134 Questions
Exam 13: Correlation and Linear Regression138 Questions
Exam 14: Multiple Regression Analysis135 Questions
Exam 15: Nonparametric Methods: Nominal Level Hypothesis Tests181 Questions
Exam 16: Nonparametric Methods: Analysis of Ordinal Data138 Questions
Exam 17: Index Numbers137 Questions
Exam 18: Time Series and Forecasting139 Questions
Exam 19: Statistical Process Control and Quality Management136 Questions
Exam 20: An Introduction to Decision Theory115 Questions
Select questions type
A useful method for eliminating fluctuations in a time series is computing a ______.
(Short Answer)
4.7/5  (33)
(33)
Product sales since 1999 are:  The least squares trend equation is given as:
Ŷ = 265.12 - 21.18t, where t is set equal to 1 for 1999.
What are the predicted sales for 2009?
The least squares trend equation is given as:
Ŷ = 265.12 - 21.18t, where t is set equal to 1 for 1999.
What are the predicted sales for 2009?
(Essay)
4.8/5 (32)
For a time series beginning with 1991 and extending up to 2010, which year would be coded with a one when using the coded method?
(Multiple Choice)
4.8/5 (35)
The Durbin-Watson statistic is used to test for correlated residuals.
(True/False)
4.8/5 (36)
For the third quarter, the sales are 1,000 units; the seasonal index for the quarter is 1.10. What are the deseasonalized sales for the quarter?
(Multiple Choice)
4.8/5 (35)
A linear trend equation is used to represent time series values when the data are changing by equal what?
(Multiple Choice)
4.7/5 (35)
Episodic and residual variations can be projected into the future.
(True/False)
4.8/5 (37)
In a linear trend equation, t is a coded value that corresponds with a time period in a time series.
(True/False)
4.9/5 (39)
A collection of data recorded over a weekly, monthly, quarterly, or yearly time interval is known as ___________.
(Multiple Choice)
4.8/5 (40)
If a trend equation is Ŷ = 15 + 75t, the periodic increase in the forecast is _____.
(Short Answer)
4.9/5 (39)
When the null hypothesis is rejected based on the Durbin-Watson statistic, what types of problems occur in regression analysis?
(Essay)
4.9/5 (37)
If the least squares equation for sales data going from 2004 to 2008 is Ŷ = 10 + 1.3t (in $millions), what is the value of t and the forecast for 2010?
(Multiple Choice)
4.8/5 (37)
An analysis of past seasonal fluctuations can be helpful in planning production for items such as toys, dolls, Easter eggs, and other holiday-oriented goods.
(True/False)
4.8/5 (34)
Using the following time series data, 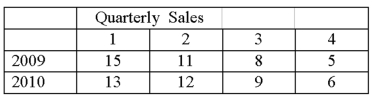 The quarterly indexes for the year 2010 will total approximately _______.
(Essay)
4.8/5 (44)
A plastics manufacturer performed a quarterly time series analysis for demands over the last five years (periods 1 through 20). The analysis resulted in the following trend equation and seasonal indexes:
Ŷ = 920.0 + 22.6t 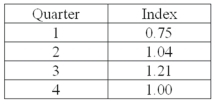 Based on the seasonal indexes, which quarter is expected to have 25% less demand than predicted by the trend line?
(Essay)
4.8/5 (33)
If the past data approximates a straight line, the equation used is Ŷ = a + bt, where a is the Y-intercept and b is the slope of the line.
(True/False)
4.9/5 (47)
Consider a three-year moving average. The weights given to each period are:
(Multiple Choice)
4.9/5 (29)
If four seasonal indexes are reported for a time series, data is thus reported _________.
(Short Answer)
4.9/5 (33)
For the third quarter, the sales are 1,500 units; the seasonal index for the quarter is 0.90. What are the deseasonalized sales for the quarter?
(Multiple Choice)
5.0/5 (34)
Filters
- Essay(0)
- Multiple Choice(0)
- Short Answer(0)
- True False(0)
- Matching(0)