Exam 18: Time Series and Forecasting
Exam 1: What Is Statistics83 Questions
Exam 2: Describing Data: Frequency Tables, Frequency Distributions, and Graphic Presentation132 Questions
Exam 3: Describing Data: Numerical Measures124 Questions
Exam 4: Describing Data: Displaying and Exploring Data113 Questions
Exam 5: A Survey of Probability Concepts134 Questions
Exam 6: Discrete Probability Distributions131 Questions
Exam 7: Continuous Probability Distributions135 Questions
Exam 8: Sampling Methods and the Central Limit Theorem117 Questions
Exam 9: Estimation and Confidence Intervals131 Questions
Exam 10: One-Sample Tests of Hypothesis110 Questions
Exam 11: Two-Sample Tests of Hypothesis98 Questions
Exam 12: Analysis of Variance134 Questions
Exam 13: Correlation and Linear Regression138 Questions
Exam 14: Multiple Regression Analysis135 Questions
Exam 15: Nonparametric Methods: Nominal Level Hypothesis Tests181 Questions
Exam 16: Nonparametric Methods: Analysis of Ordinal Data138 Questions
Exam 17: Index Numbers137 Questions
Exam 18: Time Series and Forecasting139 Questions
Exam 19: Statistical Process Control and Quality Management136 Questions
Exam 20: An Introduction to Decision Theory115 Questions
Select questions type
Product sales since 2001 are: 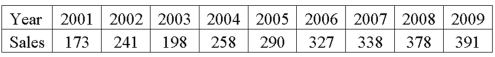 The least squares trend equation is given as:
Ŷ = 100 + 28t, where t is set equal to 1 for 2001.
What were the predicted sales for 2009?
The least squares trend equation is given as:
Ŷ = 100 + 28t, where t is set equal to 1 for 2001.
What were the predicted sales for 2009?
(Essay)
4.8/5  (37)
(37)
Given a linear time series trend Ŷ = 5.2 + 3.1t, what is the forecast for 2010 if the time series started in 2003?
(Multiple Choice)
4.8/5 (44)
When the data is divided by the seasonal indexes, the ____________ is removed from a time series.
(Short Answer)
4.8/5 (41)
To calculate quarterly typical seasonal indexes, how many periods are included in the ratio-to-moving-average method?
(Multiple Choice)
4.9/5 (37)
The _____________ method is useful in smoothing out a time series.
(Short Answer)
5.0/5 (35)
The range of possible values for the Durbin-Watson statistic is:
(Multiple Choice)
4.9/5 (35)
In the linear trend equation, Y = a + bt, the coefficient b represents ___________.
(Multiple Choice)
4.7/5 (37)
If time series data are plotted on graph paper having an arithmetic scale that increases or decreases by equal percents, what type of graph will it be?
(Multiple Choice)
4.9/5 (35)
A resort hotel performed a quarterly time series analysis for demands over the last five years (periods 1 through 20). The analysis resulted in the following trend equation and seasonal indexes:
Ŷ = 1000 + 150t 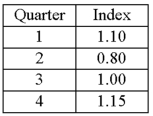 Based on the seasonal indexes, which quarter is expected to have 20% less demand than predicted by the trend line?
(Essay)
4.8/5 (30)
A plastics manufacturer performed a quarterly time series analysis for demands over the last five years (periods 1 through 20). The analysis resulted in the following trend equation and seasonal indexes:
Ŷ = 920.0 + 22.6t 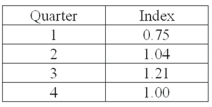 The seasonal indexes sum to 4.0. Therefore, the indexes have been _________.
(Essay)
4.8/5 (38)
A time series is a collection of data that _______________.
(Multiple Choice)
4.9/5 (40)
Which of the following statements about autocorrelation are true? I. Successive residuals are often correlated in time series because an event in one time period often influences the event in the next period.
II) If residuals are correlated, we can use r as the coefficient of correlation and conduct the common tests of hypothesis about regression coefficients.
III) A Durbin-Watson statistic d is used, instead of directly conducting a hypothesis test on r.
(Multiple Choice)
4.7/5 (41)
Product sales since 2001 are: 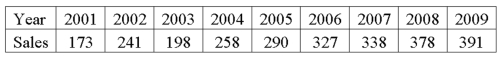 The least squares trend equation is given as:
Ŷ = 100 + 28t, where t is set equal to 1 for 2001.
On average, how much did sales change per year from 2001 to 2009?
The least squares trend equation is given as:
Ŷ = 100 + 28t, where t is set equal to 1 for 2001.
On average, how much did sales change per year from 2001 to 2009?
(Essay)
4.8/5 (43)
The forecast for the third quarter is 1,000 units; the seasonal index for the quarter is 0.85. What are the seasonally adjusted sales for the quarter?
(Multiple Choice)
4.9/5 (38)
A typical sales index of 96 for January indicates that sales are ____________________.
(Short Answer)
4.8/5 (37)
The trend forecast equation is Ŷ = 100 + 120t. The next forecast is for period 11. The typical seasonal index for period 11 is 1.25. What are the forecast sales for period 11?
(Multiple Choice)
4.8/5 (39)
A resort hotel performed a quarterly time series analysis for demands over the last five years (periods 1 through 20). The analysis resulted in the following trend equation and seasonal indexes:
Ŷ = 1000 + 150t  Using the trend line equation and the seasonal indexes, predict demand for the third quarter of the next year .
(Essay)
4.8/5 (31)
Autocorrelation occurs when successive residuals are _________.
(Short Answer)
4.7/5 (44)
Filters
- Essay(0)
- Multiple Choice(0)
- Short Answer(0)
- True False(0)
- Matching(0)