Exam 2: Describing Data: Frequency Tables, Frequency Distributions, and Graphic Presentation
Exam 1: What Is Statistics83 Questions
Exam 2: Describing Data: Frequency Tables, Frequency Distributions, and Graphic Presentation132 Questions
Exam 3: Describing Data: Numerical Measures124 Questions
Exam 4: Describing Data: Displaying and Exploring Data113 Questions
Exam 5: A Survey of Probability Concepts134 Questions
Exam 6: Discrete Probability Distributions131 Questions
Exam 7: Continuous Probability Distributions135 Questions
Exam 8: Sampling Methods and the Central Limit Theorem117 Questions
Exam 9: Estimation and Confidence Intervals131 Questions
Exam 10: One-Sample Tests of Hypothesis110 Questions
Exam 11: Two-Sample Tests of Hypothesis98 Questions
Exam 12: Analysis of Variance134 Questions
Exam 13: Correlation and Linear Regression138 Questions
Exam 14: Multiple Regression Analysis135 Questions
Exam 15: Nonparametric Methods: Nominal Level Hypothesis Tests181 Questions
Exam 16: Nonparametric Methods: Analysis of Ordinal Data138 Questions
Exam 17: Index Numbers137 Questions
Exam 18: Time Series and Forecasting139 Questions
Exam 19: Statistical Process Control and Quality Management136 Questions
Exam 20: An Introduction to Decision Theory115 Questions
Select questions type
A class interval, or class width, can be determined by subtracting the lower limit of a class from the lower limit of the next higher class.
(True/False)
4.8/5  (32)
(32)
In frequency distributions, classes are mutually exclusive if each individual, object, or measurement is included in only one category.
(True/False)
4.9/5 (33)
A student was studying the political party preferences of a university's student population. The survey instrument asked students to identify their political preference-for example, Democrat, Republican, Libertarian, or another party. The best way to illustrate the relative frequency distribution is a __________.
(Multiple Choice)
4.8/5 (32)
To construct a pie chart, relative class frequencies are used to graph the "slices" of the pie.
(True/False)
4.7/5 (24)
Refer to the following information from a frequency distribution for "heights of college women" recorded to the nearest inch: the first two class midpoints are 62.5" and 65.5". What is the class interval?
(Multiple Choice)
4.9/5 (39)
The first three class marks for a frequency distribution of "weights of college men" recorded to the nearest pound are 105, 115, and 125.
What are the class limits for the fourth class?
(Essay)
4.7/5 (38)
When data is collected using a quantitative, ratio variable, what is true about a frequency distribution that summarizes the data?
(Multiple Choice)
4.8/5 (30)
Ages (rounded to the nearest whole year) of employees at a large company were grouped into a distribution with the following class limits:
20 up to 30
30 up to 40
40 up to 50
50 up to 60
60 up to 70
What is the class interval?
(Essay)
4.8/5 (31)
Monthly commissions of first-year insurance brokers are $1,270, $1,310, $1,680, $1,380, $1,410, $1,570, $1,180 and $1,420. These figures are referred to as a(n) __________.
(Multiple Choice)
4.9/5 (34)
Refer to the following distribution of ages: 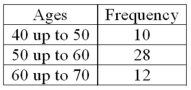 What is the class midpoint of the highest class?
(Multiple Choice)
4.8/5 (31)
A frequency distribution for nominal data requires that the categories be ___________________ and _____________________.
(Short Answer)
4.8/5 (36)
A table summarizing a set of data showing the fraction of the total number of items in several classes is a
(Multiple Choice)
5.0/5 (33)
In a deck of cards, a class of all cards that are hearts and a class of all cards that are kings are NOT _____________.
(Short Answer)
4.7/5 (37)
Refer to the following distribution: 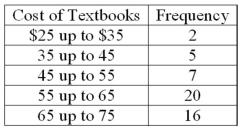 What is the class midpoint for the $45 up to $55 class?
(Multiple Choice)
4.8/5 (36)
In a bar chart, the x-axis is labeled with the values of a qualitative variable.
(True/False)
4.9/5 (35)
A student was studying the political party preferences of a university's student population. The survey instrument asked students to identify their political preference, for example, Democrat, Republican, Libertarian, or another party. The best way to illustrate the frequencies for each political preference is a __________.
(Multiple Choice)
4.8/5 (42)
In constructing a frequency polygon, class frequencies are scaled on the ______ axis.
(Short Answer)
4.8/5 (34)
Refer to the following breakdown of responses to a survey of "Are you concerned about being tracked while connected to the Internet?" 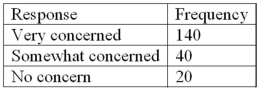 What percent of the responses indicated that users were somewhat concerned?
(Multiple Choice)
4.8/5 (33)
Refer to the following frequency distribution on days absent during a calendar year by employees of a manufacturing company: 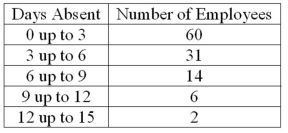 How many employees were absent fewer than six days?
(Multiple Choice)
4.9/5 (39)
A cumulative frequency distribution is used when we want to determine how many observations lie above or below certain values.
(True/False)
4.8/5 (34)
Filters
- Essay(0)
- Multiple Choice(0)
- Short Answer(0)
- True False(0)
- Matching(0)