Exam 2: Describing Data: Frequency Tables, Frequency Distributions, and Graphic Presentation
Exam 1: What Is Statistics83 Questions
Exam 2: Describing Data: Frequency Tables, Frequency Distributions, and Graphic Presentation132 Questions
Exam 3: Describing Data: Numerical Measures124 Questions
Exam 4: Describing Data: Displaying and Exploring Data113 Questions
Exam 5: A Survey of Probability Concepts134 Questions
Exam 6: Discrete Probability Distributions131 Questions
Exam 7: Continuous Probability Distributions135 Questions
Exam 8: Sampling Methods and the Central Limit Theorem117 Questions
Exam 9: Estimation and Confidence Intervals131 Questions
Exam 10: One-Sample Tests of Hypothesis110 Questions
Exam 11: Two-Sample Tests of Hypothesis98 Questions
Exam 12: Analysis of Variance134 Questions
Exam 13: Correlation and Linear Regression138 Questions
Exam 14: Multiple Regression Analysis135 Questions
Exam 15: Nonparametric Methods: Nominal Level Hypothesis Tests181 Questions
Exam 16: Nonparametric Methods: Analysis of Ordinal Data138 Questions
Exam 17: Index Numbers137 Questions
Exam 18: Time Series and Forecasting139 Questions
Exam 19: Statistical Process Control and Quality Management136 Questions
Exam 20: An Introduction to Decision Theory115 Questions
Select questions type
A class relative frequency represents a __________ of the total observations in the class.
(Short Answer)
4.8/5  (42)
(42)
Refer to the following wage breakdown for a garment factory. 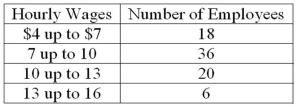 What are the class limits for the class with the smallest frequencies?
(Multiple Choice)
4.9/5 (39)
For the following distribution of heights, what are the limits for the class with the greatest frequency? 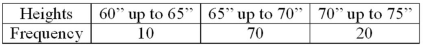
(Multiple Choice)
4.9/5 (33)
Refer to the following distribution of commissions: 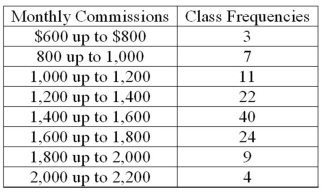 To plot a cumulative frequency distribution, the first coordinate would be _________.
(Multiple Choice)
4.7/5 (40)
To calculate a relative frequency, a class frequency is divided by ___________.
(Short Answer)
4.8/5 (36)
Refer to the following breakdown of responses to a survey of "How confident are you that you saved enough to retire?" 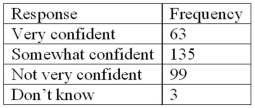 What is the class with the greatest frequency?
(Multiple Choice)
4.8/5 (33)
What is the difference between a frequency distribution and a cumulative frequency distribution?
(Essay)
4.9/5 (40)
The first three class marks for a frequency distribution of "weights of college men" recorded to the nearest pound are 105, 115, and 125.
What is the class interval?
(Essay)
4.9/5 (34)
Refer to the following distribution of commissions: 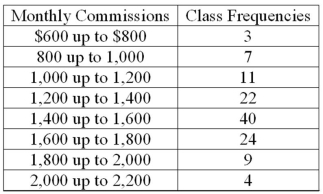 For the preceding distribution, what is the midpoint of the class with the greatest frequency?
(Multiple Choice)
4.7/5 (36)
A student was interested in the cigarette smoking habits of college students and collected data from an unbiased random sample of students. The data is summarized in the following table: 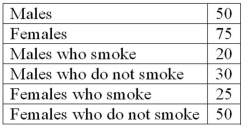 Why is the table NOT a frequency distribution?
(Multiple Choice)
4.9/5 (29)
For a relative frequency distribution, relative frequency is computed as _____________.
(Multiple Choice)
4.8/5 (37)
To construct a pie chart, the class frequencies are converted to __________.
(Short Answer)
4.9/5 (36)
A student was interested in the cigarette smoking habits of college students and collected data from an unbiased random sample of students. The data is summarized in the following table: 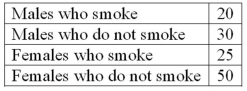 What type of chart best represents relative class frequencies?
(Multiple Choice)
4.8/5 (39)
Refer to the following breakdown of responses to a survey of "How confident are you that you saved enough to retire?"  What type of chart should be used to describe the frequency table?
(Multiple Choice)
4.9/5 (33)
Refer to the following distribution of commissions: 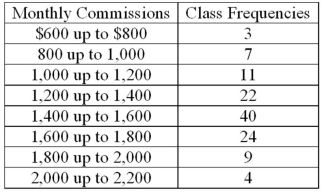 What is the relative frequency for those salespersons that earn from $1,600 up to $1,800?
(Multiple Choice)
4.8/5 (40)
A frequency distribution groups data into classes showing the number of observations in each class.
(True/False)
4.8/5 (39)
Refer to the following distribution: 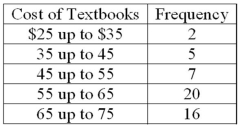 What is the relative class frequency for the $25 up to $35 class?
(Multiple Choice)
4.8/5 (30)
Refer to the following breakdown of responses to a survey of room cleanliness in a hotel. 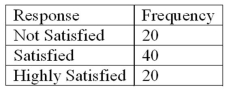 Draw a bar graph that illustrates the preceding frequency table.
(Essay)
4.9/5 (34)
To summarize the gender of students attending a college, the number of classes in a frequency distribution depends on the number of students.
(True/False)
4.7/5 (26)
Filters
- Essay(0)
- Multiple Choice(0)
- Short Answer(0)
- True False(0)
- Matching(0)