Exam 2: Describing Data: Frequency Tables, Frequency Distributions, and Graphic Presentation
Exam 1: What Is Statistics83 Questions
Exam 2: Describing Data: Frequency Tables, Frequency Distributions, and Graphic Presentation132 Questions
Exam 3: Describing Data: Numerical Measures124 Questions
Exam 4: Describing Data: Displaying and Exploring Data113 Questions
Exam 5: A Survey of Probability Concepts134 Questions
Exam 6: Discrete Probability Distributions131 Questions
Exam 7: Continuous Probability Distributions135 Questions
Exam 8: Sampling Methods and the Central Limit Theorem117 Questions
Exam 9: Estimation and Confidence Intervals131 Questions
Exam 10: One-Sample Tests of Hypothesis110 Questions
Exam 11: Two-Sample Tests of Hypothesis98 Questions
Exam 12: Analysis of Variance134 Questions
Exam 13: Correlation and Linear Regression138 Questions
Exam 14: Multiple Regression Analysis135 Questions
Exam 15: Nonparametric Methods: Nominal Level Hypothesis Tests181 Questions
Exam 16: Nonparametric Methods: Analysis of Ordinal Data138 Questions
Exam 17: Index Numbers137 Questions
Exam 18: Time Series and Forecasting139 Questions
Exam 19: Statistical Process Control and Quality Management136 Questions
Exam 20: An Introduction to Decision Theory115 Questions
Select questions type
For a frequency distribution of qualitative data, if the observations can be assigned to only one class, the classes are __________________________.
(Short Answer)
4.8/5  (26)
(26)
In a frequency distribution, the number of observations in a class is called the class ________.
(Multiple Choice)
4.9/5 (36)
Refer to the following distribution of ages: 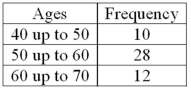 For the distribution of ages just shown, what is the relative class frequency for the lowest class?
(Multiple Choice)
5.0/5 (39)
In a bar chart, the heights of the bars represent the frequencies in each class.
(True/False)
4.8/5 (31)
A ______ chart is useful for displaying a relative frequency distribution.
(Short Answer)
4.8/5 (32)
Refer to the following distribution of commissions: 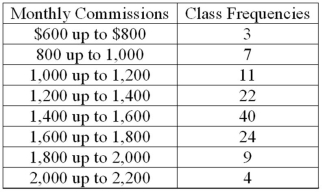 What is the relative frequency of those salespersons that earn $1,600 or more?
(Multiple Choice)
4.8/5 (38)
When a class interval is expressed as 100 up to 200, _________________________.
(Multiple Choice)
4.8/5 (31)
The number of employees less than the upper limit of each class at Lloyd's Fast Food Emporium is shown in the following table: 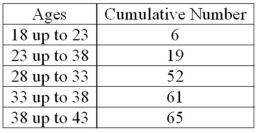 What is it called?
(Multiple Choice)
4.8/5 (32)
The midpoint of a class, which is also called a class mark, is halfway between the lower and upper limits.
(True/False)
4.8/5 (39)
For a frequency distribution of quantitative data, if every individual, object, or measurement can be assigned to a class, the frequency distribution is __________.
(Short Answer)
4.8/5 (30)
The following frequency distribution shows the distribution of delivery times (in days) for swimstuff.com customer orders during the last month. 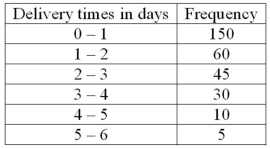 For 300 observations, our rule-of-thumb for number of classes would indicate 9 classes. In this case, what is the class interval and why would it be reasonable to use that class interval and only 6 classes?
(Essay)
5.0/5 (30)
Refer to the following breakdown of responses to a survey of room service in a hotel. 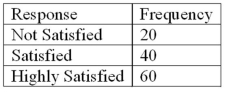 What type of chart should be used to describe the frequency table?
(Multiple Choice)
4.9/5 (31)
The following frequency distribution shows the distribution of delivery times (in days) for swimstuff.com customer orders during the last month. 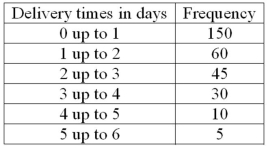 What is the relative frequency for orders delivered in less than one day?
(Essay)
4.9/5 (36)
The first three class marks for a frequency distribution of "weights of college men" recorded to the nearest pound are 105, 115, and 125.
What is the lower limit for the third class?
(Essay)
4.8/5 (24)
The following frequency distribution shows the distribution of delivery times (in days) for swimstuff.com customer orders during the last month. 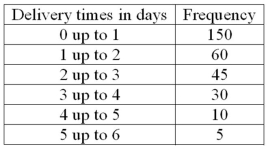 How many orders were delivered in three days or more?
(Essay)
4.8/5 (40)
The following frequency distribution shows the distribution of delivery times (in days) for swimstuff.com customer orders during the last month. 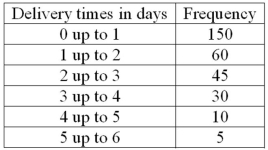 How many orders were delivered in less than one day?
(Essay)
4.8/5 (37)
Refer to the following frequency distribution on days absent during a calendar year by employees of a manufacturing company: 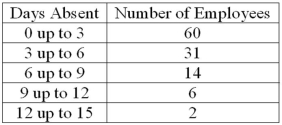 How many employees were absent six days or more?
(Multiple Choice)
4.8/5 (29)
A small sample of computer operators shows monthly incomes of $1,950, $1,775, $2,060, $1,840, $1,795, $1,890, $1,925, and $1,810. What are these ungrouped numbers called?
(Multiple Choice)
4.9/5 (44)
Refer to the following distribution: 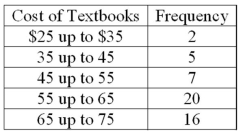 What are the class limits for the class with the highest frequency?
(Multiple Choice)
4.8/5 (40)
Filters
- Essay(0)
- Multiple Choice(0)
- Short Answer(0)
- True False(0)
- Matching(0)