Exam 2: Describing Data: Frequency Tables, Frequency Distributions, and Graphic Presentation
Exam 1: What Is Statistics83 Questions
Exam 2: Describing Data: Frequency Tables, Frequency Distributions, and Graphic Presentation132 Questions
Exam 3: Describing Data: Numerical Measures124 Questions
Exam 4: Describing Data: Displaying and Exploring Data113 Questions
Exam 5: A Survey of Probability Concepts134 Questions
Exam 6: Discrete Probability Distributions131 Questions
Exam 7: Continuous Probability Distributions135 Questions
Exam 8: Sampling Methods and the Central Limit Theorem117 Questions
Exam 9: Estimation and Confidence Intervals131 Questions
Exam 10: One-Sample Tests of Hypothesis110 Questions
Exam 11: Two-Sample Tests of Hypothesis98 Questions
Exam 12: Analysis of Variance134 Questions
Exam 13: Correlation and Linear Regression138 Questions
Exam 14: Multiple Regression Analysis135 Questions
Exam 15: Nonparametric Methods: Nominal Level Hypothesis Tests181 Questions
Exam 16: Nonparametric Methods: Analysis of Ordinal Data138 Questions
Exam 17: Index Numbers137 Questions
Exam 18: Time Series and Forecasting139 Questions
Exam 19: Statistical Process Control and Quality Management136 Questions
Exam 20: An Introduction to Decision Theory115 Questions
Select questions type
Refer to the following wage breakdown for a garment factory. 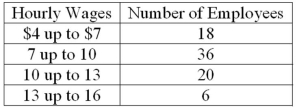 What is the class interval for the preceding table of wages?
(Multiple Choice)
4.8/5  (41)
(41)
Refer to the following information from a frequency distribution for "heights of college women" recorded to the nearest inch: the first two class midpoints are 62.5" and 65.5". What are the class limits for the third class?
(Multiple Choice)
4.8/5 (41)
When classes in a frequency table are constructed so that each observation will fit into only one class, the categories are ______________________.
(Short Answer)
4.7/5 (28)
To construct a bar chart, the class frequencies are plotted on the _________.
(Short Answer)
4.8/5 (37)
Refer to the following wage breakdown for a garment factory. 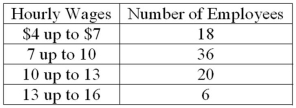 What is the class midpoint for the class with the greatest frequency?
(Multiple Choice)
4.8/5 (34)
A group of 100 students were surveyed about their interest in a new Economics major. Interest was measured in terms of high, medium, or low. In the study, 30 students responded high interest, 50 students responded medium interest, and 20 students responded low interest. What is the best way to illustrate the relative frequency of student interest?
(Multiple Choice)
4.7/5 (38)
To convert a frequency distribution to a relative frequency distribution, divide each class frequency by the number of classes.
(True/False)
4.9/5 (36)
A table showing the number of observations that have been grouped into each of several classes is called a frequency ________________.
(Short Answer)
4.9/5 (32)
The suggested class interval for a frequency distribution with data ranges from 100 to 220 with 50 observations would be _______.
(Short Answer)
4.8/5 (42)
Refer to the following breakdown of responses to a survey of room service in a hotel. 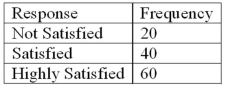 What type of chart should be used to show relative class frequencies?
(Multiple Choice)
4.9/5 (36)
The relative frequency for a class represents the ________________.
(Multiple Choice)
4.7/5 (30)
A sample distribution of hourly earnings in Paul's Cookie Factory is:  The limits of the class with the smallest frequency are:
(Multiple Choice)
4.8/5 (36)
The midpoint of a class interval is also called a class ________.
(Short Answer)
4.9/5 (34)
Refer to the following frequency distribution on days absent during a calendar year by employees of a manufacturing company: 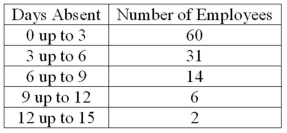 How many employees were absent for between 3 up to 6 days?
(Multiple Choice)
4.9/5 (39)
In a relative frequency distribution, the sum of the relative class frequencies is _____________________.
(Short Answer)
4.9/5 (38)
The first three class marks for a frequency distribution of "weights of college men" recorded to the nearest pound are 105, 115, and 125.
What is the upper limit for the third class?
(Essay)
4.8/5 (33)
Refer to the following breakdown of responses to a survey of "How confident are you that you saved enough to retire?" 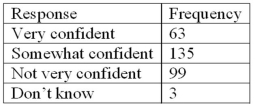 What is the class interval for the preceding frequency table?
(Multiple Choice)
4.9/5 (34)
Refer to the following breakdown of responses to a survey of room cleanliness in a hotel. 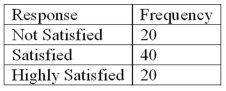 What is the class interval for the following frequency table?
(Essay)
4.8/5 (27)
Why are unequal class intervals sometimes used in a frequency distribution?
(Multiple Choice)
4.7/5 (40)
Filters
- Essay(0)
- Multiple Choice(0)
- Short Answer(0)
- True False(0)
- Matching(0)