Exam 2: Describing Data: Frequency Tables, Frequency Distributions, and Graphic Presentation
Exam 1: What Is Statistics83 Questions
Exam 2: Describing Data: Frequency Tables, Frequency Distributions, and Graphic Presentation132 Questions
Exam 3: Describing Data: Numerical Measures124 Questions
Exam 4: Describing Data: Displaying and Exploring Data113 Questions
Exam 5: A Survey of Probability Concepts134 Questions
Exam 6: Discrete Probability Distributions131 Questions
Exam 7: Continuous Probability Distributions135 Questions
Exam 8: Sampling Methods and the Central Limit Theorem117 Questions
Exam 9: Estimation and Confidence Intervals131 Questions
Exam 10: One-Sample Tests of Hypothesis110 Questions
Exam 11: Two-Sample Tests of Hypothesis98 Questions
Exam 12: Analysis of Variance134 Questions
Exam 13: Correlation and Linear Regression138 Questions
Exam 14: Multiple Regression Analysis135 Questions
Exam 15: Nonparametric Methods: Nominal Level Hypothesis Tests181 Questions
Exam 16: Nonparametric Methods: Analysis of Ordinal Data138 Questions
Exam 17: Index Numbers137 Questions
Exam 18: Time Series and Forecasting139 Questions
Exam 19: Statistical Process Control and Quality Management136 Questions
Exam 20: An Introduction to Decision Theory115 Questions
Select questions type
To summarize the gender of students attending a college in a frequency distribution, a total of at least ______ classes would be required.
(Short Answer)
4.8/5  (28)
(28)
The following frequency distribution shows the distribution of delivery times (in days) for swimstuff.com customer orders during the last month. 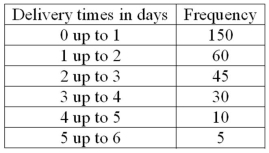 What is the relative frequency for orders delivered in three days or more?
(Essay)
4.8/5 (37)
A data set consists of 40 observations. For a quantitative variable, how many classes would you recommend for the frequency distribution?
(Essay)
4.8/5 (30)
Refer to the following breakdown of responses to a survey of "Are you concerned about being tracked while connected to the Internet?" 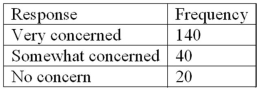 What type of chart should be used to show relative class frequencies?
(Multiple Choice)
4.9/5 (25)
The monthly salaries of a sample of 100 employees were rounded to the nearest $10. They ranged from a low of $1,040 to a high of $1,720. If we want to condense the data into seven classes, what is the most convenient class interval?
(Multiple Choice)
4.7/5 (33)
Refer to the following breakdown of responses to a survey of "How confident are you that you saved enough to retire?" 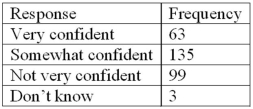 What type of chart should be used to show relative class frequencies?
(Multiple Choice)
4.9/5 (42)
Refer to the following breakdown of responses to a survey of room service in a hotel. 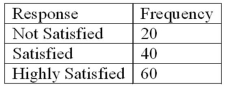 What is the class with the greatest frequency?
(Multiple Choice)
4.9/5 (37)
Refer to the following frequency distribution on days absent during a calendar year by employees of a manufacturing company: 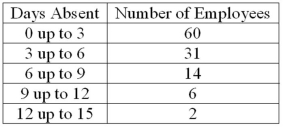 How many employees were absent from 6 up to 12 days?
(Multiple Choice)
4.7/5 (32)
Refer to the following distribution of commissions: 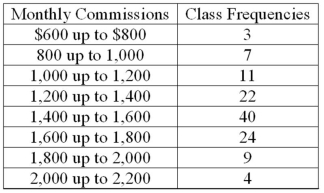 What is the class interval?
(Multiple Choice)
4.9/5 (35)
A data set has 100 observations. In the data, a quantitative variable's highest value is 117 and its lowest value is 47. What is the minimum class interval that you would recommend?
(Essay)
4.9/5 (25)
Refer to the following distribution of ages: 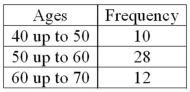 What is the class interval?
(Multiple Choice)
4.8/5 (35)
In a frequency distribution, a class defined as "Under $100" and "$1,000 and over" is called a(n) ____________.
(Short Answer)
4.8/5 (25)
The number of observations in each class of a frequency distribution is called a ________________________.
(Short Answer)
4.9/5 (31)
In a bar chart, why are there spaces between the bars on the horizontal axis?
(Essay)
4.8/5 (31)
A data set has 200 observations. In the data, a quantitative variable's highest value is 1080 and its lowest value is 960. What is the minimum class interval that you would recommend?
(Essay)
4.9/5 (35)
When data is collected using a qualitative, nominal variable (in other words, male or female), what is true about a frequency distribution that summarizes the data?
(Multiple Choice)
4.8/5 (35)
When data is collected using a qualitative, nominal variable, what is true about a frequency distribution that summarizes the data?
(Multiple Choice)
4.8/5 (32)
Filters
- Essay(0)
- Multiple Choice(0)
- Short Answer(0)
- True False(0)
- Matching(0)