Exam 2: Describing Data: Frequency Tables, Frequency Distributions, and Graphic Presentation
Exam 1: What Is Statistics83 Questions
Exam 2: Describing Data: Frequency Tables, Frequency Distributions, and Graphic Presentation132 Questions
Exam 3: Describing Data: Numerical Measures124 Questions
Exam 4: Describing Data: Displaying and Exploring Data113 Questions
Exam 5: A Survey of Probability Concepts134 Questions
Exam 6: Discrete Probability Distributions131 Questions
Exam 7: Continuous Probability Distributions135 Questions
Exam 8: Sampling Methods and the Central Limit Theorem117 Questions
Exam 9: Estimation and Confidence Intervals131 Questions
Exam 10: One-Sample Tests of Hypothesis110 Questions
Exam 11: Two-Sample Tests of Hypothesis98 Questions
Exam 12: Analysis of Variance134 Questions
Exam 13: Correlation and Linear Regression138 Questions
Exam 14: Multiple Regression Analysis135 Questions
Exam 15: Nonparametric Methods: Nominal Level Hypothesis Tests181 Questions
Exam 16: Nonparametric Methods: Analysis of Ordinal Data138 Questions
Exam 17: Index Numbers137 Questions
Exam 18: Time Series and Forecasting139 Questions
Exam 19: Statistical Process Control and Quality Management136 Questions
Exam 20: An Introduction to Decision Theory115 Questions
Select questions type
Refer to the following breakdown of responses to a survey of room service in a hotel. 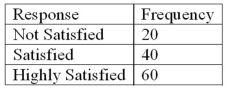 What percent of the responses indicated that customers were satisfied?
(Multiple Choice)
4.9/5  (38)
(38)
Refer to the following breakdown of responses to a survey of room cleanliness in a hotel. 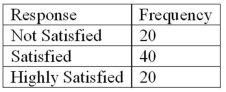 What is the class with the greatest frequency?
(Essay)
4.9/5 (33)
Refer to the following breakdown of responses to a survey of room service in a hotel. 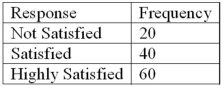 What is the class interval for the frequency table above?
(Multiple Choice)
4.9/5 (33)
Refer to the following breakdown of responses to a survey of room cleanliness in a hotel. 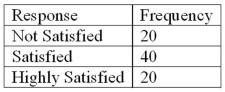 Draw a pie chart that illustrates the relative frequencies.
(Essay)
4.8/5 (35)
A _____ chart is useful for displaying a frequency distribution for a qualitative variable.
(Short Answer)
4.7/5 (31)
The following frequency distribution shows the distribution of delivery times (in days) for swimstuff.com customer orders during the last month. 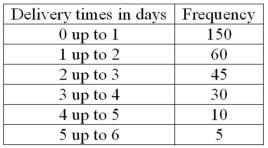 How many orders were delivered in less than three days?
(Essay)
4.7/5 (35)
A student was studying the political party preferences of a university's student population. The survey instrument asked students to identify themselves as a Democrat or a Republican. This question is flawed because:
(Multiple Choice)
4.9/5 (33)
Refer to the following breakdown of responses to a survey of room cleanliness in a hotel. 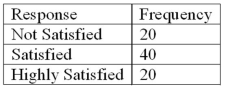 Draw a bar graph that illustrates the relative frequencies.
(Essay)
4.8/5 (31)
A data set has 200 observations. In the data, a qualitative variable's highest value is "extremely satisfied" and its lowest value is "extremely dissatisfied." What is the minimum class interval that you would recommend?
(Essay)
4.8/5 (45)
A ___________ is useful for displaying the relative frequency distribution for a nominal variable.
(Short Answer)
4.8/5 (30)
In order to convert class frequency to relative class frequency, we
(Multiple Choice)
4.9/5 (34)
To construct a histogram, the class frequencies are plotted on the ________.
(Short Answer)
4.9/5 (43)
Filters
- Essay(0)
- Multiple Choice(0)
- Short Answer(0)
- True False(0)
- Matching(0)