Exam 2: Descriptive Statistics: Tabular and Graphical Displays
Exam 1: Data and Statistics85 Questions
Exam 2: Descriptive Statistics: Tabular and Graphical Displays112 Questions
Exam 3: Descriptive Statistics: Numerical Measures139 Questions
Exam 4: Introduction to Probability129 Questions
Exam 5: Discrete Probability Distributions150 Questions
Exam 6: Continuous Probability Distributions144 Questions
Exam 7: Sampling and Sampling Distributions119 Questions
Exam 8: Interval Estimation118 Questions
Exam 9: Hypothesis Tests118 Questions
Exam 10: Inference About Means and Proportions With Two Populations127 Questions
Exam 11: Inferences About Population Variances113 Questions
Exam 12: Tests of Goodness of Fit, Independence and Multiple Proportions76 Questions
Exam 13: Experimental Design and Analysis of Variance125 Questions
Exam 14: Simple Linear Regression103 Questions
Exam 15: Multiple Regression109 Questions
Exam 16: Regression Analysis: Model Building82 Questions
Exam 17: Time Series Analysis and Forecasting80 Questions
Exam 18: Nonparametric Methods83 Questions
Exam 19: Statistical Methods for Quality Control75 Questions
Exam 20: Decision Analysis71 Questions
Exam 21: Sample Survey68 Questions
Select questions type
Exhibit 2-3
The number of sick days taken (per month) by 200 factory workers is summarized below.  -Refer to Exhibit 2-3. The cumulative frequency for the class of 11 - 15
(Multiple Choice)
4.9/5  (32)
(32)
Missy Walters owns a mail-order business specializing in clothing, linens, and furniture for children. She is considering offering her customers a discount on shipping charges for furniture based on the dollar-amount of the furniture order. Before Missy decides the discount policy, she needs a better understanding of the dollar-amount distribution of the furniture orders she receives.Missy had an assistant randomly select 50 recent orders that included furniture. The assistant recorded the value, to the nearest dollar, of the furniture portion of each order. The data collected is listed below.  a. Prepare a frequency distribution, relative frequency distribution, and percent frequency distribution for the data set using a class width of $50.
b. Construct a histogram showing the percent frequency distribution of the furniture-order values in the sample.
c. Develop a cumulative frequency distribution and a cumulative percent frequency distribution for this data.
a. Prepare a frequency distribution, relative frequency distribution, and percent frequency distribution for the data set using a class width of $50.
b. Construct a histogram showing the percent frequency distribution of the furniture-order values in the sample.
c. Develop a cumulative frequency distribution and a cumulative percent frequency distribution for this data.
(Essay)
4.8/5 (38)
For the following observations, plot a scatter diagram and indicate what kind of relationship (if any) exist between x and y. 
(Essay)
4.8/5 (34)
Exhibit 2-1
The numbers of hours worked (per week) by 400 statistics students are shown below.  -Refer to Exhibit 2-1. The cumulative percent frequency for the class of 30 - 39 is
(Multiple Choice)
4.8/5 (38)
Exhibit 2-1
The numbers of hours worked (per week) by 400 statistics students are shown below.
-Refer to Exhibit 2-1. The cumulative relative frequency for the class of 20 - 29
(Multiple Choice)
4.9/5 (39)
The sum of the percent frequencies for all classes will always equal
(Multiple Choice)
4.9/5 (36)
You are given the following data on the earnings per share for ten companies. Construct a stem-and-leaf display. Specify the leaf unit for the display. 
(Essay)
4.8/5 (33)
The manager of Hudson Auto Repair would like to get a better picture of the distribution of costs for new parts used in the engine tune-up jobs done in the garage. A sample of 50 customer invoices for tune-ups has been taken and the costs of parts, rounded to the nearest dollar, are listed below. 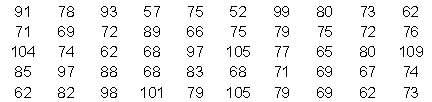 Develop a frequency distribution for these cost data. Use your own judgment to determine the number of classes and class width that provide a distribution that will be meaningful and helpful to the manager.
a. Develop a stem-and-leaf display showing both the rank order and shape of the data set.
b. Develop a stretched stem-and-leaf display using two stems for each leading digit(s).
c. Which display is better at revealing the natural grouping and variation in the data?
Develop a frequency distribution for these cost data. Use your own judgment to determine the number of classes and class width that provide a distribution that will be meaningful and helpful to the manager.
a. Develop a stem-and-leaf display showing both the rank order and shape of the data set.
b. Develop a stretched stem-and-leaf display using two stems for each leading digit(s).
c. Which display is better at revealing the natural grouping and variation in the data?
(Essay)
4.9/5 (26)
In constructing a frequency distribution, as the number of classes are decreased, the class width
(Multiple Choice)
4.8/5 (36)
Exhibit 2-1
The numbers of hours worked (per week) by 400 statistics students are shown below.
-Refer to Exhibit 2-1. If a cumulative frequency distribution is developed for the above data, the last class will have a cumulative frequency of
(Multiple Choice)
4.9/5 (39)
Excel's __________ can be used to construct a frequency distribution for quantitative data.
(Multiple Choice)
4.9/5 (31)
Categorical data can be graphically represented by using a(n)
(Multiple Choice)
4.8/5 (37)
Exhibit 2-1
The numbers of hours worked (per week) by 400 statistics students are shown below.
-Refer to Exhibit 2-1. The percentage of students working 19 hours or less is
(Multiple Choice)
4.8/5 (39)
Data that provide labels or names for groupings of like items are known as
(Multiple Choice)
4.9/5 (38)
Exhibit 2-3
The number of sick days taken (per month) by 200 factory workers is summarized below.
-Refer to Exhibit 2-3. The relative frequency of workers who took 10 or fewer sick days
(Multiple Choice)
4.8/5 (32)
Guests staying at Marada Inn were asked to rate the quality of their accommodations as being excellent, above average, average, below average, or poor. The ratings provided by a sample of 20 quests are shown below. 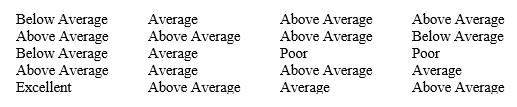 a. Provide a frequency distribution showing the number of occurrences of each rating level in the sample.
b. Construct relative frequency and percent frequency distributions for the data.
c. Display the frequencies graphically with a bar graph.
d. Display the percent frequencies graphically with a pie chart.
a. Provide a frequency distribution showing the number of occurrences of each rating level in the sample.
b. Construct relative frequency and percent frequency distributions for the data.
c. Display the frequencies graphically with a bar graph.
d. Display the percent frequencies graphically with a pie chart.
(Essay)
4.7/5 (26)
Exhibit 2-2
Information on the type of industry is provided for a sample of 50 Fortune 500 companies.  -Refer to Exhibit 2-2. The percent frequency of industries that are classified as electronics is
(Multiple Choice)
4.8/5 (31)
Which of the following graphical methods is not intended for quantitative data?
(Multiple Choice)
4.9/5 (35)
Filters
- Essay(0)
- Multiple Choice(0)
- Short Answer(0)
- True False(0)
- Matching(0)