Exam 3: Descriptive Statistics: Numerical Measures
Exam 1: Data and Statistics85 Questions
Exam 2: Descriptive Statistics: Tabular and Graphical Displays112 Questions
Exam 3: Descriptive Statistics: Numerical Measures139 Questions
Exam 4: Introduction to Probability129 Questions
Exam 5: Discrete Probability Distributions150 Questions
Exam 6: Continuous Probability Distributions144 Questions
Exam 7: Sampling and Sampling Distributions119 Questions
Exam 8: Interval Estimation118 Questions
Exam 9: Hypothesis Tests118 Questions
Exam 10: Inference About Means and Proportions With Two Populations127 Questions
Exam 11: Inferences About Population Variances113 Questions
Exam 12: Tests of Goodness of Fit, Independence and Multiple Proportions76 Questions
Exam 13: Experimental Design and Analysis of Variance125 Questions
Exam 14: Simple Linear Regression103 Questions
Exam 15: Multiple Regression109 Questions
Exam 16: Regression Analysis: Model Building82 Questions
Exam 17: Time Series Analysis and Forecasting80 Questions
Exam 18: Nonparametric Methods83 Questions
Exam 19: Statistical Methods for Quality Control75 Questions
Exam 20: Decision Analysis71 Questions
Exam 21: Sample Survey68 Questions
Select questions type
Which of the following symbols represents the mean of the sample?
(Multiple Choice)
4.9/5  (37)
(37)
If a data set has an even number of observations, the median
(Multiple Choice)
4.9/5 (31)
Since the population size is always larger than the sample size, then the sample statistic
(Multiple Choice)
4.9/5 (40)
A numerical measure, such as a mean, computed from a population is known as a
(Multiple Choice)
4.9/5 (29)
Generally, which one of the following is the least appropriate measure of central tendency for a data set that contains outliers?
(Multiple Choice)
4.9/5 (31)
Given below is a sample of 70 monthly rents for one-bedroom apartments presented as grouped data in the form of a frequency distribution. Compute the sample mean, variance, and standard deviation. 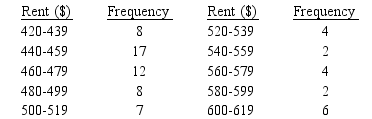
(Essay)
4.9/5 (36)
Excel's __________ function can be used to compute the mode.
(Multiple Choice)
4.9/5 (41)
The following frequency distribution shows the time (in minutes) that a sample of students uses the computer terminals per day.  a.Compute the mean.
b.Compute the variance.
c.Compute the standard deviation.
d.Compute the coefficient of variation.
a.Compute the mean.
b.Compute the variance.
c.Compute the standard deviation.
d.Compute the coefficient of variation.
(Short Answer)
4.7/5 (37)
A researcher has obtained the number of hours worked per week during the summer for a sample of fifteen students.  Using this data set, compute the
a. median
b. mean
c. mode
d. 40th percentile
e. range
f. sample variance
g. standard deviation
Using this data set, compute the
a. median
b. mean
c. mode
d. 40th percentile
e. range
f. sample variance
g. standard deviation
(Short Answer)
4.8/5 (44)
A sample of twelve families was taken. Each family was asked how many times per week they dine in restaurants. Their responses are given below.  Using this data set, compute the
a. mode
b. median
c. mean
d. range
e. interquartile range
f. variance
g. standard deviation
h. coefficient of variation
Using this data set, compute the
a. mode
b. median
c. mean
d. range
e. interquartile range
f. variance
g. standard deviation
h. coefficient of variation
(Essay)
4.9/5 (32)
Exhibit 3-4
The following is the frequency distribution for the speeds of a sample of automobiles traveling on an interstate highway.  -Refer to Exhibit 3-4. The mean is
(Multiple Choice)
4.7/5 (39)
The weights (in pounds) of a sample of 36 individuals were recorded and the following statistics were calculated  The coefficient of variation equals
(Multiple Choice)
4.9/5 (44)
Missy Walters owns a mail-order business specializing in baby clothes. She is considering offering her customers a discount on shipping charges based on the dollar-amount of the mail order. Before Missy decides the discount policy, she needs a better understanding of the dollar-amount distribution of the mail orders she receives. Missy had an assistant randomly select 50 recent orders and record the value, to the nearest dollar, of each order as shown below.  a. Determine the mean, median, and mode for this data set.
b. Determine the 80th percentile.
c. Determine the first quartile.
d. Determine the range and interquartile range.
e. Determine the sample variance, sample standard deviation, and coefficient of variation.
f. Determine the z-scores for the minimum and maximum values in the data set.
a. Determine the mean, median, and mode for this data set.
b. Determine the 80th percentile.
c. Determine the first quartile.
d. Determine the range and interquartile range.
e. Determine the sample variance, sample standard deviation, and coefficient of variation.
f. Determine the z-scores for the minimum and maximum values in the data set.
(Essay)
4.8/5 (40)
Exhibit 3-2
A researcher has collected the following sample data. The mean of the sample is 5.  -The __________ denotes the number of standard deviations xi is from the mean
  .
.
(Multiple Choice)
4.8/5 (42)
Filters
- Essay(0)
- Multiple Choice(0)
- Short Answer(0)
- True False(0)
- Matching(0)