Exam 3: Descriptive Statistics: Numerical Measures
Exam 1: Data and Statistics85 Questions
Exam 2: Descriptive Statistics: Tabular and Graphical Displays112 Questions
Exam 3: Descriptive Statistics: Numerical Measures139 Questions
Exam 4: Introduction to Probability129 Questions
Exam 5: Discrete Probability Distributions150 Questions
Exam 6: Continuous Probability Distributions144 Questions
Exam 7: Sampling and Sampling Distributions119 Questions
Exam 8: Interval Estimation118 Questions
Exam 9: Hypothesis Tests118 Questions
Exam 10: Inference About Means and Proportions With Two Populations127 Questions
Exam 11: Inferences About Population Variances113 Questions
Exam 12: Tests of Goodness of Fit, Independence and Multiple Proportions76 Questions
Exam 13: Experimental Design and Analysis of Variance125 Questions
Exam 14: Simple Linear Regression103 Questions
Exam 15: Multiple Regression109 Questions
Exam 16: Regression Analysis: Model Building82 Questions
Exam 17: Time Series Analysis and Forecasting80 Questions
Exam 18: Nonparametric Methods83 Questions
Exam 19: Statistical Methods for Quality Control75 Questions
Exam 20: Decision Analysis71 Questions
Exam 21: Sample Survey68 Questions
Select questions type
The following data represent the daily demand (y in thousands of units) and the unit price (x in dollars) for a product.  a.Compute and interpret the sample covariance for the above data.
b.Compute and interpret the sample correlation coefficient.
a.Compute and interpret the sample covariance for the above data.
b.Compute and interpret the sample correlation coefficient.
(Essay)
4.8/5  (28)
(28)
Excel's __________ function can be used to compute the sample standard deviation.
(Multiple Choice)
4.9/5 (29)
A numerical measure of linear association between two variables is the
(Multiple Choice)
4.8/5 (37)
The starting salaries of a sample of community college graduates are given below.  a.Compute the mean.
b.Compute the variance.
c.Compute the standard deviation.
d.Compute the coefficient of variation.
a.Compute the mean.
b.Compute the variance.
c.Compute the standard deviation.
d.Compute the coefficient of variation.
(Short Answer)
4.8/5 (43)
The number of hours worked per week for a sample of ten students is shown below.  a.Determine the median and explain its meaning.
b.Compute the 70th percentile and explain its meaning.
c.What is the mode of the above data? What does it signify?
a.Determine the median and explain its meaning.
b.Compute the 70th percentile and explain its meaning.
c.What is the mode of the above data? What does it signify?
(Essay)
4.8/5 (39)
The measure of variability easiest to compute, but seldom used as the only measure, is the
(Multiple Choice)
4.7/5 (35)
The manager of Hudson Auto Repair has recorded the following frequency distribution for the cost of new parts used in doing an engine tune-up in a sample of 50 tune-ups. 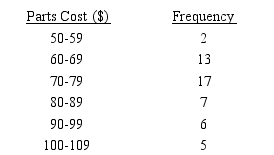 Compute the sample mean, variance, and standard deviation.
(Essay)
4.9/5 (33)
Exhibit 3-2
A researcher has collected the following sample data. The mean of the sample is 5.  -A(n) __________ is an unusually small or unusually large data value.
(Multiple Choice)
4.8/5 (39)
Excel's __________ function can be used to compute the sample variance.
(Multiple Choice)
5.0/5 (32)
An important numerical measure of the shape of a distribution is the
(Multiple Choice)
4.9/5 (29)
The following observations are given for two variables.  a.Compute and interpret the sample covariance for the above data.
b.Compute and interpret the sample correlation coefficient.
a.Compute and interpret the sample covariance for the above data.
b.Compute and interpret the sample correlation coefficient.
(Essay)
4.8/5 (37)
The measure of location that is the most likely to be influenced by extreme values in the data set is the
(Multiple Choice)
4.8/5 (30)
The descriptive measure of dispersion that is based on the concept of a deviation about the mean is
(Multiple Choice)
4.8/5 (36)
In computing the pth percentile, if the index i is an integer the pth percentile is the
(Multiple Choice)
4.7/5 (36)
During a cold winter, the temperature stayed below zero for ten days (ranging from -20 to -5). The variance of the temperatures of the ten day period
(Multiple Choice)
4.9/5 (42)
Filters
- Essay(0)
- Multiple Choice(0)
- Short Answer(0)
- True False(0)
- Matching(0)