Exam 3: Descriptive Statistics: Numerical Measures
Exam 1: Data and Statistics85 Questions
Exam 2: Descriptive Statistics: Tabular and Graphical Displays112 Questions
Exam 3: Descriptive Statistics: Numerical Measures139 Questions
Exam 4: Introduction to Probability129 Questions
Exam 5: Discrete Probability Distributions150 Questions
Exam 6: Continuous Probability Distributions144 Questions
Exam 7: Sampling and Sampling Distributions119 Questions
Exam 8: Interval Estimation118 Questions
Exam 9: Hypothesis Tests118 Questions
Exam 10: Inference About Means and Proportions With Two Populations127 Questions
Exam 11: Inferences About Population Variances113 Questions
Exam 12: Tests of Goodness of Fit, Independence and Multiple Proportions76 Questions
Exam 13: Experimental Design and Analysis of Variance125 Questions
Exam 14: Simple Linear Regression103 Questions
Exam 15: Multiple Regression109 Questions
Exam 16: Regression Analysis: Model Building82 Questions
Exam 17: Time Series Analysis and Forecasting80 Questions
Exam 18: Nonparametric Methods83 Questions
Exam 19: Statistical Methods for Quality Control75 Questions
Exam 20: Decision Analysis71 Questions
Exam 21: Sample Survey68 Questions
Select questions type
The hourly wages of a sample of eight individuals is given below.  For the above sample, determine the following measures:
a.The mean.
b.The standard deviation.
c.The 25th percentile.
For the above sample, determine the following measures:
a.The mean.
b.The standard deviation.
c.The 25th percentile.
(Short Answer)
4.7/5  (30)
(30)
The most frequently occurring value of a data set is called the
(Multiple Choice)
4.8/5 (32)
Exhibit 3-2
A researcher has collected the following sample data. The mean of the sample is 5.  -__________ can be used to make statements about the proportion of data values that must be within a specified number of standard deviations of the mean.
(Multiple Choice)
4.7/5 (42)
Which of the following symbols represents the size of the sample?
(Multiple Choice)
4.9/5 (38)
A sample of 9 mothers was taken. The mothers were asked the age of their oldest child. You are given their responses below.  a. Compute the mean.
b. Compute the variance.
c. Compute the standard deviation.
d. Compute the coefficient of variation.
e. Determine the 25th percentile.
f. Determine the median
g. Determine the 75th percentile.
h. Determine the range.
a. Compute the mean.
b. Compute the variance.
c. Compute the standard deviation.
d. Compute the coefficient of variation.
e. Determine the 25th percentile.
f. Determine the median
g. Determine the 75th percentile.
h. Determine the range.
(Essay)
4.8/5 (28)
The variance of a sample of 81 observations equals 64. The standard deviation of the sample equals
(Multiple Choice)
4.8/5 (37)
The following is a frequency distribution for the ages of a sample of employees at a local company.  a.Determine the average age for the sample.
b.Compute the variance.
c.Compute the standard deviation.
d.Compute the coefficient of variation.
a.Determine the average age for the sample.
b.Compute the variance.
c.Compute the standard deviation.
d.Compute the coefficient of variation.
(Short Answer)
4.9/5 (36)
The descriptive measure that is not measured in the same units as the original data is the
(Multiple Choice)
4.8/5 (29)
Exhibit 3-1
A researcher has collected the following sample data.  -The interquartile range is
(Multiple Choice)
4.8/5 (37)
Reed Auto periodically has a special week-long sale. As part of the advertising campaign Reed runs one or more television commercials during the weekend preceding the sale. Data from a sample of 5 previous sales are shown below. 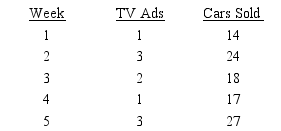 Compute and interpret both the sample covariance and the sample correlation coefficient.
(Essay)
4.9/5 (32)
Exhibit 3-2
A researcher has collected the following sample data. The mean of the sample is 5.
-__________ can be used to determine the percentage of data values that must be within one, two, and three standard deviations of the mean for data having a bell-shaped distribution.
(Multiple Choice)
4.8/5 (42)
The measure of dispersion that is influenced most by extreme values is
(Multiple Choice)
4.9/5 (39)
Exhibit 3-2
A researcher has collected the following sample data. The mean of the sample is 5.
-Refer to Exhibit 3-2. The variance is
(Multiple Choice)
5.0/5 (30)
Since the median is the middle value of a data set, it must always be
(Multiple Choice)
4.8/5 (42)
Filters
- Essay(0)
- Multiple Choice(0)
- Short Answer(0)
- True False(0)
- Matching(0)