Exam 13: Experimental Design and Analysis of Variance
Exam 1: Data and Statistics85 Questions
Exam 2: Descriptive Statistics: Tabular and Graphical Displays112 Questions
Exam 3: Descriptive Statistics: Numerical Measures139 Questions
Exam 4: Introduction to Probability129 Questions
Exam 5: Discrete Probability Distributions150 Questions
Exam 6: Continuous Probability Distributions144 Questions
Exam 7: Sampling and Sampling Distributions119 Questions
Exam 8: Interval Estimation118 Questions
Exam 9: Hypothesis Tests118 Questions
Exam 10: Inference About Means and Proportions With Two Populations127 Questions
Exam 11: Inferences About Population Variances113 Questions
Exam 12: Tests of Goodness of Fit, Independence and Multiple Proportions76 Questions
Exam 13: Experimental Design and Analysis of Variance125 Questions
Exam 14: Simple Linear Regression103 Questions
Exam 15: Multiple Regression109 Questions
Exam 16: Regression Analysis: Model Building82 Questions
Exam 17: Time Series Analysis and Forecasting80 Questions
Exam 18: Nonparametric Methods83 Questions
Exam 19: Statistical Methods for Quality Control75 Questions
Exam 20: Decision Analysis71 Questions
Exam 21: Sample Survey68 Questions
Select questions type
Exhibit 13-7
The following is part of an ANOVA table, which was the results of three treatments and a total of 15 observations.  -Refer to Exhibit 13-7. The computed test statistics is
(Multiple Choice)
5.0/5  (38)
(38)
For four populations, the population variances are assumed to be equal. Random samples from each population provide the following data.  Using a .05 level of significance, test to see if the means for all four populations are the same.
(Essay)
4.8/5 (36)
A dietician wants to see if there is any difference in the effectiveness of three diets. Eighteen people, comprising a sample, were randomly assigned to the three diets. Below you are given the total amount of weight lost in a month by each person.  a.State the null and alternative hypotheses.
b.Calculate the test statistic.
c.What would you advise the dietician about the effectiveness of the three diets? Use a .05 level of significance.
a.State the null and alternative hypotheses.
b.Calculate the test statistic.
c.What would you advise the dietician about the effectiveness of the three diets? Use a .05 level of significance.
(Essay)
4.9/5 (28)
Exhibit 13-7
The following is part of an ANOVA table, which was the results of three treatments and a total of 15 observations.
-Random samples were selected from three populations. The data obtained are shown below.  At a 5% level of significance, test to see if there is a significant difference in the means of the three populations. (Please note that the sample sizes are not equal.)
(Essay)
4.9/5 (37)
Random samples of individuals from three different cities were asked how much time they spend per day watching television. The results (in minutes) for the three groups are shown below.  At = 0.05, test to see if there is a significant difference in the averages of the three groups.
(Essay)
5.0/5 (32)
Exhibit 13-7
The following is part of an ANOVA table, which was the results of three treatments and a total of 15 observations.
-If we are testing for the equality of 3 population means, we should use the
(Multiple Choice)
4.9/5 (38)
The following are the results from a completely randomized design consisting of 3 treatments.  a.Using = .05, test to see if there is a significant difference among the means of the three populations. The sample sizes for the three treatments are equal.
b.If in Part a you concluded that at least one mean is different from the others, determine which mean(s) is (are) different. The three sample means are= 17.000,= 21.625, and= 26.875. Use Fisher's LSD procedure and let = .05.
a.Using = .05, test to see if there is a significant difference among the means of the three populations. The sample sizes for the three treatments are equal.
b.If in Part a you concluded that at least one mean is different from the others, determine which mean(s) is (are) different. The three sample means are= 17.000,= 21.625, and= 26.875. Use Fisher's LSD procedure and let = .05.
(Essay)
4.9/5 (37)
In an analysis of variance problem involving 3 treatments and 10 observations per treatment, SSE = 399.6. The MSE for this situation is
(Multiple Choice)
4.9/5 (25)
Exhibit 13-2  -Refer to Exhibit 13-2. The null hypothesis is to be tested at the 5% level of significance. The critical value from the table is
(Multiple Choice)
4.9/5 (39)
Samples were selected from three populations. The data obtained are shown below. 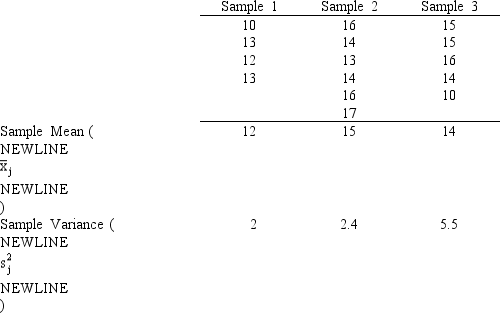 a.Set up the ANOVA table for this problem.
b.At a 5% level of significance test to determine whether there is a significant difference in the means of the three populations.
a.Set up the ANOVA table for this problem.
b.At a 5% level of significance test to determine whether there is a significant difference in the means of the three populations.
(Essay)
4.7/5 (39)
Three different brands of tires were compared for wear characteristics. From each brand of tire, ten tires were randomly selected and subjected to standard wear-testing procedures. The average mileage obtained for each brand of tire and sample variances (both in 1,000 miles) are shown below.  Show the complete ANOVA table for this problem.
(Essay)
4.9/5 (43)
Exhibit 13-7
The following is part of an ANOVA table, which was the results of three treatments and a total of 15 observations.
-Guitars R. US has three stores located in three different areas. Random samples of the sales of the three stores (in $1000) are shown below:  At a 5% level of significance, test to see if there is a significant difference in the average sales of the three stores. (Please note that the sample sizes are not equal.)
(Essay)
4.7/5 (38)
The F ratio in a completely randomized ANOVA is the ratio of
(Multiple Choice)
4.7/5 (44)
Exhibit 13-7
The following is part of an ANOVA table, which was the results of three treatments and a total of 15 observations.
-In a completely randomized experimental design, 18 experimental units were used for the first treatment, 10 experimental units for the second treatment, and 15 experimental units for the third treatment. Part of the ANOVA table for this experiment is shown below.  a.Fill in all the blanks in the above ANOVA table.
b.At a 5% level of significance, test to see if there is a significant difference among the means.
a.Fill in all the blanks in the above ANOVA table.
b.At a 5% level of significance, test to see if there is a significant difference among the means.
(Essay)
4.8/5 (37)
Three universities in your state decided to administer the same comprehensive examination to the recipients of MBA degrees from the three institutions. From each institution, MBA recipients were randomly selected and were given the test. The following table shows the scores of the students from each university.  At = 0.01, test to see if there is any significant difference in the average scores of the students from the three universities. (Note that the sample sizes are not equal.)
(Essay)
4.8/5 (35)
Employees of MNM Corporation are about to undergo a retraining program. Management is trying to determine which of three programs is the best. They believe that the effectiveness of the programs may be influenced by gender. A factorial experiment was designed. You are given the following information.  What advice would you give MNM? Use Excel and a .05 level of significance.
(Essay)
4.9/5 (45)
The required condition for using an ANOVA procedure on data from several populations is that the
(Multiple Choice)
4.8/5 (37)
Exhibit 13-3
To test whether or not there is a difference between treatments A, B, and C, a sample of 12 observations has been randomly assigned to the 3 treatments. You are given the results below.  -Refer to Exhibit 13-3. The null hypothesis is to be tested at the 1% level of significance. The critical value from the table is
(Multiple Choice)
4.8/5 (41)
Exhibit 13-1  -Refer to Exhibit 13-1. The mean square between treatments (MSTR) equals
(Multiple Choice)
4.8/5 (41)
In ANOVA, which of the following is not affected by whether or not the population means are equal?
(Multiple Choice)
4.7/5 (39)
Filters
- Essay(0)
- Multiple Choice(0)
- Short Answer(0)
- True False(0)
- Matching(0)