Exam 15: Inference With Regression Models
Exam 1: Statistics and Data68 Questions
Exam 2: Tabular and Graphical Methods99 Questions
Exam 3: Numerical Descriptive Measures123 Questions
Exam 4: Basic Probability Concepts107 Questions
Exam 5: Discrete Probability Distributions118 Questions
Exam 6: Continuous Probability Distributions114 Questions
Exam 7: Sampling and Sampling Distributions110 Questions
Exam 8: Interval Estimation111 Questions
Exam 9: Hypothesis Testing111 Questions
Exam 10: Statistical Inference Concerning Two Populations104 Questions
Exam 11: Statistical Inference Concerning Variance96 Questions
Exam 12: Chi-Square Tests100 Questions
Exam 13: Analysis of Variance89 Questions
Exam 14: Regression Analysis116 Questions
Exam 15: Inference With Regression Models117 Questions
Exam 16: Regression Models for Nonlinear Relationships95 Questions
Exam 17: Regression Models With Dummy Variables117 Questions
Exam 18: Time Series and Forecasting103 Questions
Exam 19: Returns, Index Numbers and Inflation98 Questions
Exam 20: Nonparametric Tests99 Questions
Select questions type
The alternative hypothesis for the test of joint significance is specified as: HA: At least two βj ≠ 0.
(True/False)
4.8/5  (38)
(38)
Exhibit 15-4.A researcher analyzes the factors that may influence amusement park attendance and estimates the following model:  , where Attendance is the daily attendance (in 1000s),Price is the gate price (in $),and Rides is the number of rides at the amusement park.The researcher would like to construct interval estimates for Attendance when Price and Rides equal $85 and 30,respectively.The researcher estimates a modified model where Attendance is the response variable and the explanatory variables are now defined as
  and
and  .A portion of the regression results is shown in the accompanying table.
 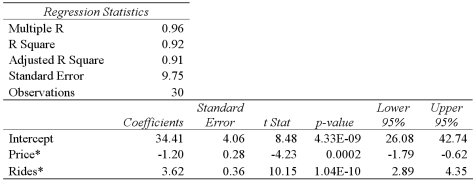 Refer to Exhibit 15-4.According to the modified model,what is a 95% prediction interval for Attendance when Price and Rides equal $85 and 30,respectively? (Note that
  . )
. )
(Multiple Choice)
4.8/5 (35)
In a multiple regression based on 30 observations,the following information is provided:
(Essay)
4.9/5 (32)
When some explanatory variables of a regression model are strongly correlated,this phenomenon is called serial correlation.
(True/False)
4.9/5 (31)
The accompanying table shows the regression results when estimating 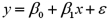 .Is x significantly related to y at the 5% significance level?
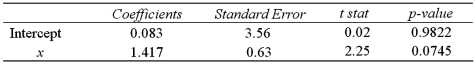
(Multiple Choice)
4.7/5 (35)
A manager at a local bank analyzed the relationship between monthly salary (y,in $)and length of service (x,measured in months)for 30 employees.The following table summarizes a portion of the regression results: 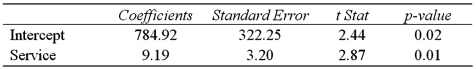 a.Specify the competing hypotheses to determine whether Service is significant in explaining Salary.
B)At the 5% significance level,is Service significant? Explain.
a.Specify the competing hypotheses to determine whether Service is significant in explaining Salary.
B)At the 5% significance level,is Service significant? Explain.
(Essay)
4.9/5 (31)
A researcher analyzes the factors that may influence the poverty rate and estimates the following model: 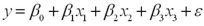 ,
where y is the poverty rate (y,in %),x1 is the percent of the population with at least a high school education,x2 is the median income ( in $1000s),and x3 is the mortality rate (per 1,000 residents).The researcher would like to construct interval estimates for y when x1,x2,and x3 equal 85%,$50,000,and 10,respectively.The researcher estimates a modified model where poverty rate is the response variable and the explanatory variables are now defined as
,
where y is the poverty rate (y,in %),x1 is the percent of the population with at least a high school education,x2 is the median income ( in $1000s),and x3 is the mortality rate (per 1,000 residents).The researcher would like to construct interval estimates for y when x1,x2,and x3 equal 85%,$50,000,and 10,respectively.The researcher estimates a modified model where poverty rate is the response variable and the explanatory variables are now defined as 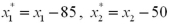 ,and
,and  .A portion of the regression results is shown in the accompanying table.
 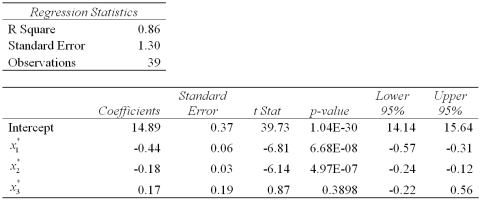 a.According to the modified model,what is the point estimate for the poverty rate when x1,x2,and x3 equal 85%,$50,000,and 10,respectively.
B)According to the modified model,what is a 95% confidence interval for the expected poverty rate when x1,x2,and x3 equal 85%,$50,000,and 10,respectively? (Note that
a.According to the modified model,what is the point estimate for the poverty rate when x1,x2,and x3 equal 85%,$50,000,and 10,respectively.
B)According to the modified model,what is a 95% confidence interval for the expected poverty rate when x1,x2,and x3 equal 85%,$50,000,and 10,respectively? (Note that  . )
C)According to the modified model,what is a 95% prediction interval for the poverty rate when x1,x2,and x3 equal 85%,$50,000,and 10,respectively? (Note that
. )
C)According to the modified model,what is a 95% prediction interval for the poverty rate when x1,x2,and x3 equal 85%,$50,000,and 10,respectively? (Note that  . )
. )
(Essay)
4.9/5 (39)
A simple linear regression,  ,is estimated using time-series data over the last 10 years.The residuals e,and the time variable t are shown in the accompanying table.
  a.Graph the residuals e against time and look for any discernible pattern.
B)Which assumption is being violated? Discuss its consequences and suggest a possible remedy.
a.Graph the residuals e against time and look for any discernible pattern.
B)Which assumption is being violated? Discuss its consequences and suggest a possible remedy.
(Essay)
4.9/5 (35)
A sociologist estimates the following regression relating Poverty (y)to Education (x1):
(Essay)
4.9/5 (30)
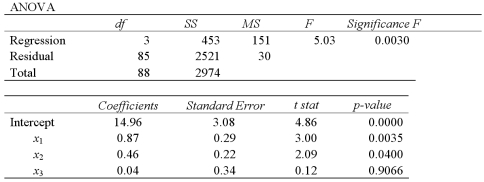
When estimating a multiple regression model based on 30 observations,the following results were obtained. 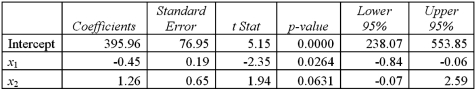 a.Specify the hypotheses to determine whether x1 is linearly related to y.At the 5 % significance level,use the p-value approach to complete the test.Are x1 and y linearly related?
B)Construct the 95% confidence interval for β2.Using this confidence interval,is x2 significant in explaining y? Explain.
C)At the 5% significance level,can you conclude that β1differs from -1? Show the relevant steps of the appropriate hypothesis test.
a.Specify the hypotheses to determine whether x1 is linearly related to y.At the 5 % significance level,use the p-value approach to complete the test.Are x1 and y linearly related?
B)Construct the 95% confidence interval for β2.Using this confidence interval,is x2 significant in explaining y? Explain.
C)At the 5% significance level,can you conclude that β1differs from -1? Show the relevant steps of the appropriate hypothesis test.
(Essay)
4.9/5 (37)
Exhibit 15-9.An economist estimates the following model: 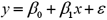 .She would like to construct interval estimates for y when x equals 2.She estimates a modified model where y is the response variable and the explanatory variable is now defined as
  .A portion of the regression results is shown in the accompanying table.
 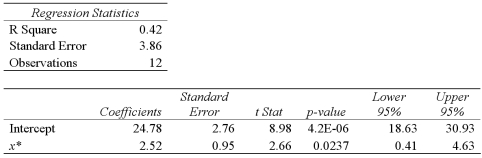 Refer to Exhibit 15-9.According to the modified model,what is a 95% confidence interval for
  when x equals 2? (Note that
  . )
. )
(Multiple Choice)
4.8/5 (34)
When confronted with multicollinearity,a good remedy is to ____ if we can justify its redundancy.
(Multiple Choice)
4.9/5 (33)
An analyst examines the effect that various variables have on crop yield.He estimates
(Essay)
4.7/5 (37)
A sociologist studies the relationship between a district's average score on a standardized test for 10th grade students (y),the average school expenditures per student (x1in $1000s),and an index of socioeconomic status of the district (x2).The results of the regression are: 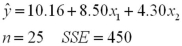 He would like to determine whether the influence of expenditures on test scores differs from the influence of the index on test scores,or
  .The results of the restricted model for this test are:
 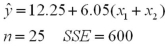 a.Formulate the hypotheses to determine whether Expenditures and Index Rate have the same influence on Scores.
B)Calculate the value of the test statistic.
C)At the 5% significance level,find the critical value(s).
D)What is the conclusion to the test?
a.Formulate the hypotheses to determine whether Expenditures and Index Rate have the same influence on Scores.
B)Calculate the value of the test statistic.
C)At the 5% significance level,find the critical value(s).
D)What is the conclusion to the test?
(Essay)
4.9/5 (32)
Exhibit 15-5.The accompanying table shows the regression results when estimating 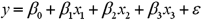 .
.  Refer to Exhibit 15-5.At the 5% significance level,which explanatory variable(s)is(are)individually significant?
(Multiple Choice)
4.9/5 (36)
Refer to the portion of regression results in the accompanying table.When testing the overall significance of the regression model at the 5% level given a critical value of 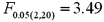 ,the decision is to:
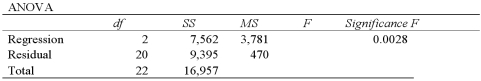
(Multiple Choice)
4.8/5 (36)
An investment analyst wants to examine the relationship between a mutual fund's return,its turnover rate and its expense ratio.She randomly selects 10 mutual funds and estimates: Return = β0 + β1 Turnover + β2 Expense + ε,where Return is the average five-year return (in %),Turnover is the annual holdings turnover (in %),Expense is the annual expense ratio (in %),and ε is the random error component.A portion of the regression results is shown in the accompanying table.
(Essay)
4.8/5 (42)
A researcher gathers data on 25 households and estimates the following model:  .A residual plot of the estimated model is shown in the accompanying graph.What can be inferred from the residual plot?
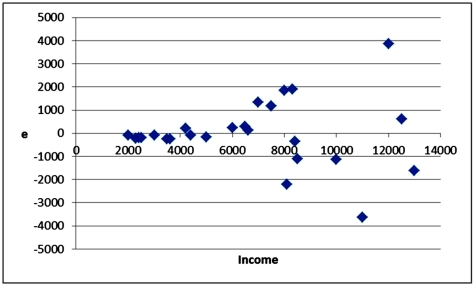
(Multiple Choice)
4.8/5 (39)
Filters
- Essay(0)
- Multiple Choice(0)
- Short Answer(0)
- True False(0)
- Matching(0)