Exam 15: Inference With Regression Models
Exam 1: Statistics and Data68 Questions
Exam 2: Tabular and Graphical Methods99 Questions
Exam 3: Numerical Descriptive Measures123 Questions
Exam 4: Basic Probability Concepts107 Questions
Exam 5: Discrete Probability Distributions118 Questions
Exam 6: Continuous Probability Distributions114 Questions
Exam 7: Sampling and Sampling Distributions110 Questions
Exam 8: Interval Estimation111 Questions
Exam 9: Hypothesis Testing111 Questions
Exam 10: Statistical Inference Concerning Two Populations104 Questions
Exam 11: Statistical Inference Concerning Variance96 Questions
Exam 12: Chi-Square Tests100 Questions
Exam 13: Analysis of Variance89 Questions
Exam 14: Regression Analysis116 Questions
Exam 15: Inference With Regression Models117 Questions
Exam 16: Regression Models for Nonlinear Relationships95 Questions
Exam 17: Regression Models With Dummy Variables117 Questions
Exam 18: Time Series and Forecasting103 Questions
Exam 19: Returns, Index Numbers and Inflation98 Questions
Exam 20: Nonparametric Tests99 Questions
Select questions type
Exhibit 15-1.An marketing analyst wants to examine the relationship between sales (in $1,000s)and advertising (in $100s)for firms in the food and beverage industry and so collects monthly data for 25 firms.He estimates the model  .The following table shows a portion of the regression results.
  Refer to Exhibit 15-1.Specify the competing hypotheses in order to test whether Advertising is significant in predicting Sales.
(Multiple Choice)
4.8/5  (36)
(36)
In regression,multicollinearity is considered problematic when two or more explanatory variables are:
(Multiple Choice)
4.9/5 (41)
A simple linear regression, ,is estimated using cross-sectional data from 10 firms.The resulting residuals e,along with the values of the explanatory variable Advertising (x,in $100s),are shown in the accompanying table.
  a.Graph the residuals e against Advertising (x)and look for any discernible pattern.
b.Which assumption is being violated? Discuss its consequences and suggest a possible remedy.
a.Graph the residuals e against Advertising (x)and look for any discernible pattern.
b.Which assumption is being violated? Discuss its consequences and suggest a possible remedy.
(Essay)
4.9/5 (34)
When estimating  ,you wish to test
  versus
  .The value of the test statistic is
  and its associated p-value is 0.1073.At the 5% significance level,the conclusion is to:
(Multiple Choice)
4.8/5 (30)
An investment analyst wants to examine the relationship between a mutual fund's return,its turnover rate and its expense ratio.She randomly selects 10 mutual funds and estimates: Return = β0 + β1 Turnover + β2 Expense + ε,where Return is the average five-year return (in %),Turnover is the annual holdings turnover (in %),Expense is the annual expense ratio (in %),and ε is the random error component.A portion of the regression results is shown in the accompanying table. 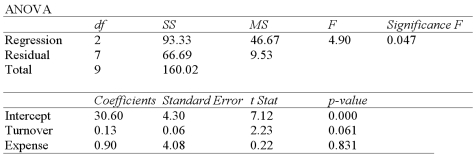
(Essay)
4.8/5 (27)
Exhibit 15-4.A researcher analyzes the factors that may influence amusement park attendance and estimates the following model:  , where Attendance is the daily attendance (in 1000s),Price is the gate price (in $),and Rides is the number of rides at the amusement park.The researcher would like to construct interval estimates for Attendance when Price and Rides equal $85 and 30,respectively.The researcher estimates a modified model where Attendance is the response variable and the explanatory variables are now defined as
 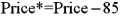 and
and 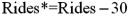 .A portion of the regression results is shown in the accompanying table.
 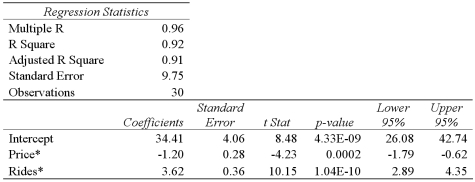 Refer to Exhibit 15-4.According to the modified model,what is a 95% confidence interval for expected Attendance when Price and Rides equal $85 and 30,respectively? (Note that
  . )
. )
(Multiple Choice)
4.8/5 (33)
Consider the following simple linear regression model:  .When determining whether there is a negative linear relationship between x and y,the alternative hypothesis takes the form
(Multiple Choice)
4.7/5 (38)
Exhibit 15-9.An economist estimates the following model:  .She would like to construct interval estimates for y when x equals 2.She estimates a modified model where y is the response variable and the explanatory variable is now defined as
  .A portion of the regression results is shown in the accompanying table.
 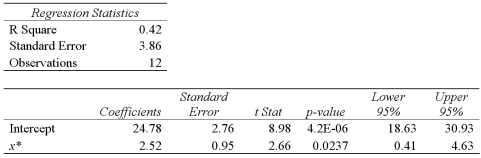 Refer to Exhibit 15-9.According to the modified model,what is a 95% prediction interval for y when x equals 2? (Note that
  . )
. )
(Multiple Choice)
4.8/5 (36)
The accompanying table shows the regression results when estimating 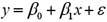 .
.  a.Specify the competing hypotheses to determine whether x is significant in y.
B)At the 5% significance level,is x significant? Explain.
a.Specify the competing hypotheses to determine whether x is significant in y.
B)At the 5% significance level,is x significant? Explain.
(Essay)
4.9/5 (37)
If in the multiple linear model the slope coefficient βi is negative,it suggests an inverse (negative)relationship between the explanatory variable xi and the response variable.
(True/False)
4.7/5 (38)
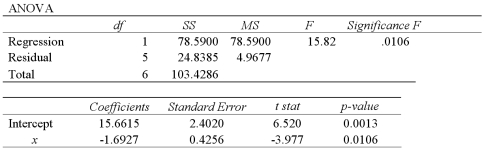
Given the following portion of regression results,which of the following conclusions is true with regard to the F test at the 5% significance level? 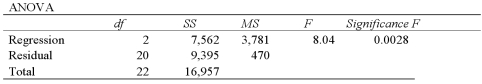
(Multiple Choice)
4.7/5 (32)
Assume you ran a multiple regression to gain a better understanding of the relationship between lumber sales,housing starts,and commercial construction.The regression uses Lumber Sales (in $100,000s)as the response variable with Housing Starts (in 1000s)and Commercial Construction (in 1000s)as the explanatory variables.The results of the regression are:
(Essay)
4.7/5 (35)
A sociologist studies the relationship between a district's average score on a standardized test for 10th grade students (y),the average school expenditures per student (x1in $1000s),and an index of socioeconomic status of the district (x2).The results of the regression are:
(Essay)
4.8/5 (28)
The restricted model is a reduced model where we estimate the coefficients that are restricted under the null hypothesis.
(True/False)
4.8/5 (37)
Exhibit 15-1.An marketing analyst wants to examine the relationship between sales (in $1,000s)and advertising (in $100s)for firms in the food and beverage industry and so collects monthly data for 25 firms.He estimates the model  .The following table shows a portion of the regression results.
  Refer to Exhibit 15-1.When testing whether the slope coefficient differs from 3,the value of the test statistic is:
(Multiple Choice)
4.9/5 (34)
When estimating  ,you wish to test
  versus
  .The value of the test statistic is
  and its associated p-value is 0.0092.At the 1% significance level,the conclusion is to:
(Multiple Choice)
4.7/5 (42)
The accompanying table shows the regression results when estimating  .
.  a.Specify the competing hypotheses to determine whether the explanatory variables are jointly significant.
B)At the 5% significance level,are the explanatory variables jointly significant? Explain.
C)At the 5% significance level,is x2 significant in explaining y? Explain.
D)At the 5% significance level,is the slope coefficient attached to x3 different from -2?
a.Specify the competing hypotheses to determine whether the explanatory variables are jointly significant.
B)At the 5% significance level,are the explanatory variables jointly significant? Explain.
C)At the 5% significance level,is x2 significant in explaining y? Explain.
D)At the 5% significance level,is the slope coefficient attached to x3 different from -2?
(Essay)
4.8/5 (34)
Filters
- Essay(0)
- Multiple Choice(0)
- Short Answer(0)
- True False(0)
- Matching(0)