Exam 15: Inference With Regression Models
Exam 1: Statistics and Data68 Questions
Exam 2: Tabular and Graphical Methods99 Questions
Exam 3: Numerical Descriptive Measures123 Questions
Exam 4: Basic Probability Concepts107 Questions
Exam 5: Discrete Probability Distributions118 Questions
Exam 6: Continuous Probability Distributions114 Questions
Exam 7: Sampling and Sampling Distributions110 Questions
Exam 8: Interval Estimation111 Questions
Exam 9: Hypothesis Testing111 Questions
Exam 10: Statistical Inference Concerning Two Populations104 Questions
Exam 11: Statistical Inference Concerning Variance96 Questions
Exam 12: Chi-Square Tests100 Questions
Exam 13: Analysis of Variance89 Questions
Exam 14: Regression Analysis116 Questions
Exam 15: Inference With Regression Models117 Questions
Exam 16: Regression Models for Nonlinear Relationships95 Questions
Exam 17: Regression Models With Dummy Variables117 Questions
Exam 18: Time Series and Forecasting103 Questions
Exam 19: Returns, Index Numbers and Inflation98 Questions
Exam 20: Nonparametric Tests99 Questions
Select questions type
Consider the following simple linear regression model:  .When determining whether there is a one-to-one relationship between x and y,the null hypothesis takes the form
(Multiple Choice)
4.8/5  (35)
(35)
In a simple linear regression based on 30 observations,the following information is provided:
(Essay)
4.9/5 (37)
Assume you ran a multiple regression to gain a better understanding of the relationship between lumber sales,housing starts,and commercial construction.The regression uses Lumber Sales (in $100,000s)as the response variable with Housing Starts (in 1000s)and Commercial Construction (in 1000s)as the explanatory variables.The results of the regression are: 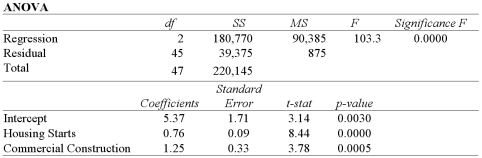 a.At the 5% significance level,are the explanatory variables jointly significant in explaining Lumber Sales? Explain.
B)At the 5% significance level,is Commercial Construction significant in explaining Lumber Sales? Explain.
C)At the 5% significance level,can you conclude that the slope coefficient attached to Housing Starts differs from 1? Explain.
a.At the 5% significance level,are the explanatory variables jointly significant in explaining Lumber Sales? Explain.
B)At the 5% significance level,is Commercial Construction significant in explaining Lumber Sales? Explain.
C)At the 5% significance level,can you conclude that the slope coefficient attached to Housing Starts differs from 1? Explain.
(Essay)
4.9/5 (30)
In regression,the two types of interval estimates concerning y are called:
(Multiple Choice)
4.7/5 (36)
Exhibit 15-8.A real estate analyst believes that the three main factors that influence an apartment's rent in a college town are the number of bedrooms,the number of bathrooms,and the apartment's square footage.For 40 apartments,she collects data on the rent (y,in $),the number of bedrooms (x1),the number of bathrooms (x2),and its square footage (x3).She estimates the following model:  .The following table shows a portion of the regression results.
 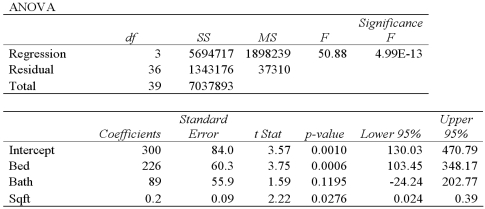 Refer to Exhibit 15-8.When testing whether the explanatory variables are jointly significant at the 5% level,she
(Multiple Choice)
4.8/5 (44)
Exhibit 15-7.A manager at a local bank analyzed the relationship between monthly salary (y,in $)and length of service (x,measured in months)for 30 employees.She estimates  .The following table summarizes a portion of the regression results:
  Refer to Exhibit 15-7.Which of the hypotheses will determine whether the intercept differs from zero?
(Multiple Choice)
4.8/5 (34)
Exhibit 15-6.Tiffany & Co.has been the world's premier jeweler since 1837.The performance of Tiffany's stock is likely to be strongly influenced by the economy.Monthly data for Tiffany's risk-adjusted return and the risk-adjusted market return are collected for a five-year period (n = 60).The accompanying table shows the regression results when estimating the CAPM model for Tiffany's return. 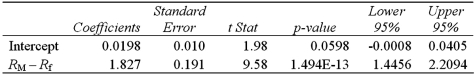 Refer to Exhibit 15-6.When testing whether the beta coefficient is significantly greater than one,the relevant critical value at the 5% significance level is
  .The conclusion to the test is:
(Multiple Choice)
4.9/5 (41)
Exhibit 15-7.A manager at a local bank analyzed the relationship between monthly salary (y,in $)and length of service (x,measured in months)for 30 employees.She estimates  .The following table summarizes a portion of the regression results:
 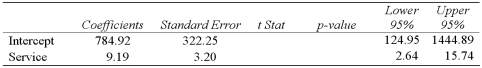 Refer to Exhibit 15-7.Using the 95% confidence interval,what is the conclusion to the following hypothesis test:
 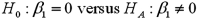 ?
?
(Multiple Choice)
4.8/5 (47)
A crucial assumption in a regression model is that the error term is not correlated with any of the explanatory variables.
(True/False)
4.9/5 (39)
Refer to the portion of regression results in the accompanying table.When testing the overall significance of the regression model at the 5% level given a critical value of 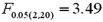 ,the decision is to:
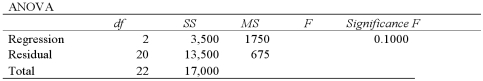
(Multiple Choice)
4.9/5 (30)
Consider the following regression results based on 30 observations. 
 a.Formulate the hypotheses to determine whether the influences of x2 and x3 differ in explaining y.
B)Calculate the value of the test statistic.
C)At the 5% significance level,find the critical value(s).
D)What is your conclusion to the test?
a.Formulate the hypotheses to determine whether the influences of x2 and x3 differ in explaining y.
B)Calculate the value of the test statistic.
C)At the 5% significance level,find the critical value(s).
D)What is your conclusion to the test?
(Essay)
4.8/5 (29)
A marketing manager examines the relationship between the attendance at amusement parks and the price of admission.He estimates the following model:  ,
where Attendance is the average daily number of people who attend an amusement park in July (in 1000s)and Price is the price of admission.The marketing manager would like to construct interval estimates for Attendance when Price equals $80.The researcher estimates a modified model where Attendance is the response variable and the Price is now defined as
,
where Attendance is the average daily number of people who attend an amusement park in July (in 1000s)and Price is the price of admission.The marketing manager would like to construct interval estimates for Attendance when Price equals $80.The researcher estimates a modified model where Attendance is the response variable and the Price is now defined as 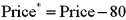 .A portion of the regression results is shown in the accompanying table.
 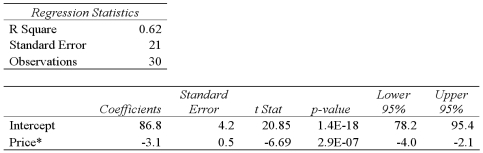 a.According to the modified model,what is the point estimate for Attendance when Price equals $80?
B)According to the modified model,what is a 95% confidence interval for Attendance when Price equals $80? (Note that
a.According to the modified model,what is the point estimate for Attendance when Price equals $80?
B)According to the modified model,what is a 95% confidence interval for Attendance when Price equals $80? (Note that  . )
C)According to the modified model,what is a 95% prediction interval for Attendance when Price equals $80? (Note that
. )
C)According to the modified model,what is a 95% prediction interval for Attendance when Price equals $80? (Note that  . )
. )
(Essay)
4.9/5 (36)
When testing r linear restrictions imposed on the model 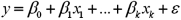 ,the test statistic is assumed to follow the
  distribution with
(Multiple Choice)
4.8/5 (33)
Exhibit 15-8.A real estate analyst believes that the three main factors that influence an apartment's rent in a college town are the number of bedrooms,the number of bathrooms,and the apartment's square footage.For 40 apartments,she collects data on the rent (y,in $),the number of bedrooms (x1),the number of bathrooms (x2),and its square footage (x3).She estimates the following model:  .The following table shows a portion of the regression results.
  Refer to Exhibit 15-8.When testing whether Bath is significant at the 5% level,she
(Multiple Choice)
4.8/5 (42)
Consider the following regression results based on 30 observations. 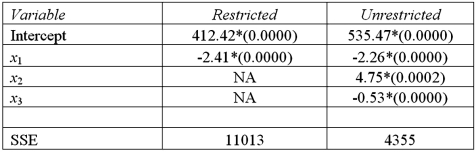 Notes: Parameter estimates are in the main body of the table with the p-values in parentheses;* represents significance at 5% level.The last row presents the error sum of squares.
A)Formulate the hypotheses to determine whether x2 and x3 are jointly significant in explaining y.
B)Define the restricted and the unrestricted models needed to conduct the test.
C)Calculate the value of the test statistic.
D)At the 5% significance level,find the critical value(s).
E)What is your conclusion to the test?
Notes: Parameter estimates are in the main body of the table with the p-values in parentheses;* represents significance at 5% level.The last row presents the error sum of squares.
A)Formulate the hypotheses to determine whether x2 and x3 are jointly significant in explaining y.
B)Define the restricted and the unrestricted models needed to conduct the test.
C)Calculate the value of the test statistic.
D)At the 5% significance level,find the critical value(s).
E)What is your conclusion to the test?
(Essay)
4.9/5 (27)
Exhibit 15-8.A real estate analyst believes that the three main factors that influence an apartment's rent in a college town are the number of bedrooms,the number of bathrooms,and the apartment's square footage.For 40 apartments,she collects data on the rent (y,in $),the number of bedrooms (x1),the number of bathrooms (x2),and its square footage (x3).She estimates the following model:  .The following table shows a portion of the regression results.
  Refer to Exhibit 15-8.When testing whether the explanatory variables Bath and Sqft are jointly significant,the p-value associated with the test is 0.0039.At the 5% significance level,she
(Multiple Choice)
4.9/5 (39)
In regression,the predicted values concerning y are subject to:
(Multiple Choice)
4.7/5 (38)
The test statistic for testing the individual significance is assumed to follow the t distribution with n - k - 2 degrees of freedom,where n is the sample size and k is the number of explanatory variables.
(True/False)
4.8/5 (31)
Exhibit 15-1.An marketing analyst wants to examine the relationship between sales (in $1,000s)and advertising (in $100s)for firms in the food and beverage industry and so collects monthly data for 25 firms.He estimates the model  .The following table shows a portion of the regression results.
  Refer to Exhibit 15-1.Specify the competing hypotheses in order to test whether the slope coefficient differs from 3.
(Multiple Choice)
4.8/5 (33)
Filters
- Essay(0)
- Multiple Choice(0)
- Short Answer(0)
- True False(0)
- Matching(0)