Exam 42: Ecosystems and Energy
Exam 1: Introduction: Evolution and the Foundations of Biology36 Questions
Exam 2: The Chemical Context of Life137 Questions
Exam 3: Carbon and the Molecular Diversity of Life136 Questions
Exam 4: A Tour of the Cell75 Questions
Exam 5: Membrane Transport and Cell Signaling97 Questions
Exam 6: An Introduction to Metabolism79 Questions
Exam 7: Cellular Respiration and Fermentation100 Questions
Exam 8: Photosynthesis72 Questions
Exam 9: The Cell Cycle56 Questions
Exam 10: Meiosis and Sexual Life Cycles62 Questions
Exam 11: Mendel and the Gene Idea63 Questions
Exam 12: The Chromosomal Basis of Inheritance46 Questions
Exam 13: The Molecular Basis of Inheritance67 Questions
Exam 14: Gene Expression: From Gene to Protein80 Questions
Exam 15: Regulation of Gene Expression50 Questions
Exam 16: Development, Stem Cells, and Cancer34 Questions
Exam 17: Viruses35 Questions
Exam 18: Genomes and Their Evolution29 Questions
Exam 19: Descent With Modification55 Questions
Exam 20: Phylogeny60 Questions
Exam 21: The Evolution of Populations70 Questions
Exam 22: The Origin of Species67 Questions
Exam 23: Broad Patterns of Evolution45 Questions
Exam 24: Early Life and the Diversification of Prokaryotes88 Questions
Exam 25: The Origin and Diversification of Eukaryotes71 Questions
Exam 26: The Colonization of Land by Plants and Fungi126 Questions
Exam 27: The Rise of Animal Diversity88 Questions
Exam 28: Plant Structure and Growth59 Questions
Exam 29: Resource Acquisition, Nutrition, and Transport in Vascular Plants110 Questions
Exam 30: Reproduction and Domestication of Flowering Plants67 Questions
Exam 31: Plant Responses to Internal and External Signals75 Questions
Exam 32: Homeostasis and Endocrine Signaling120 Questions
Exam 33: Animal Nutrition67 Questions
Exam 34: Circulation and Gas Exchange88 Questions
Exam 35: The Immune System91 Questions
Exam 36: Reproduction and Development118 Questions
Exam 37: Neurons, Synapses, and Signaling76 Questions
Exam 38: Nervous and Sensory Systems99 Questions
Exam 39: Motor Mechanisms and Behavior79 Questions
Exam 40: Population Ecology and the Distribution of Organisms93 Questions
Exam 41: Species Interactions60 Questions
Exam 42: Ecosystems and Energy90 Questions
Exam 43: Global Ecology and Conservation Biology72 Questions
Select questions type
How is it that satellites can detect differences in primary productivity on Earth?
(Multiple Choice)
4.8/5  (33)
(33)
A porcupine eats 3,000 J of plant material. Of this, 2,100 J are indigestible and are eliminated as feces, 800 J are used in cellular respiration, and 100 J are used for growth and reproduction. What is the approximate production efficiency of this animal?
(Multiple Choice)
4.9/5 (46)
How is net ecosystem production (NEP) typically estimated in ecosystems?
(Multiple Choice)
5.0/5 (42)
Photosynthetic organisms are unique to most ecosystems because they
(Multiple Choice)
4.8/5 (32)
Please use the following information to answer the question(s) below.
The tundra biome is rapidly changing as a result of global warming. Studying the energy budget of the tundra can help scientists to evaluate the magnitude of these changes. In a randomly selected square meter of tundra, the amount of plant biomass is 200 g. The amount of new plant biomass added in a year is 100 g. In the same square meter, the total biomass added in a year is 15 g. A grasshopper that eats 1 g of plant biomass is able to use 0.15 g of that biomass for growth. The grasshopper cannot assimilate 50% of the plant's biomass.
-If the total amount of energy from light converted into chemical energy in this square meter of tundra is 200 g, what is the amount of autotrophic respiration?
(Multiple Choice)
4.8/5 (45)
Which statement best describes what ultimately happens to the chemical energy that is not converted to new biomass in the process of energy transfer between trophic levels in an ecosystem?
(Multiple Choice)
5.0/5 (35)
Which of the following ecosystems would likely have a larger net primary productivity/hectare, and why?
(Multiple Choice)
5.0/5 (37)
How is it that the open ocean produces the highest net primary productivity of Earth's ecosystems, yet net primary productivity per square meter is relatively low?
(Multiple Choice)
4.7/5 (26)
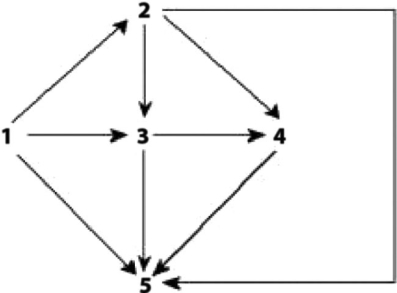 Figure 42.1 Food web for a particular terrestrial ecosystem (arrows represent energy flow and numbers represent species)
-Examine the food web for a particular terrestrial ecosystem in Figure 42.1. Which species is most likely a decomposer in this food web?
Figure 42.1 Food web for a particular terrestrial ecosystem (arrows represent energy flow and numbers represent species)
-Examine the food web for a particular terrestrial ecosystem in Figure 42.1. Which species is most likely a decomposer in this food web?
(Multiple Choice)
4.9/5 (41)
Which of these ecosystems has the highest net primary productivity per square meter annually?
(Multiple Choice)
4.8/5 (34)
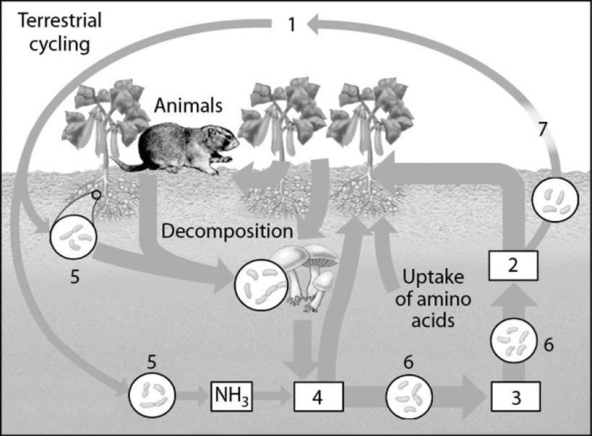 Figure 42.3
-In the diagram of the nitrogen cycle in Figure 42.3, which number represents nitrogen-fixing bacteria?
Figure 42.3
-In the diagram of the nitrogen cycle in Figure 42.3, which number represents nitrogen-fixing bacteria?
(Multiple Choice)
4.9/5 (33)
Subtraction of which of the following will convert gross primary productivity into net primary productivity?
(Multiple Choice)
4.9/5 (34)
Figure 42.1 Food web for a particular terrestrial ecosystem (arrows represent energy flow and numbers represent species)
-Examine the food web for a particular terrestrial ecosystem in Figure 42.1. Which pair of species acquire energy from more than one trophic level?
(Multiple Choice)
4.8/5 (34)
Please use the following information to answer the question(s) below.
A scientist conducts an experiment to quantify the effect of mycorrhizae and soil nitrogen levels on plant growth in a grassland. The experiment has four treatments: (1) Mycorrhizae present and ambient levels of nitrogen, (2) mycorrhizae present and nitrogen added, (3) mycorrhizae absent and ambient levels of nitrogen, and (3) mycorrhizae absent and nitrogen added. After four weeks, the scientist removes the aboveground plant material for weighing. 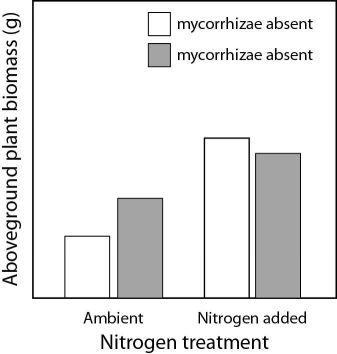 Figure 42.4.
-What is the dependent variable in the experiment shown in Figure 42.4?
Figure 42.4.
-What is the dependent variable in the experiment shown in Figure 42.4?
(Multiple Choice)
4.9/5 (40)
Please use the following information to answer the question(s) below.
The tundra biome is rapidly changing as a result of global warming. Studying the energy budget of the tundra can help scientists to evaluate the magnitude of these changes. In a randomly selected square meter of tundra, the amount of plant biomass is 200 g. The amount of new plant biomass added in a year is 100 g. In the same square meter, the total biomass added in a year is 15 g. A grasshopper that eats 1 g of plant biomass is able to use 0.15 g of that biomass for growth. The grasshopper cannot assimilate 50% of the plant's biomass.
-What is the amount of secondary production described in this scenario?
(Multiple Choice)
4.8/5 (33)
The total biomass of photosynthetic autotrophs present in an ecosystem is known as
(Multiple Choice)
4.7/5 (35)
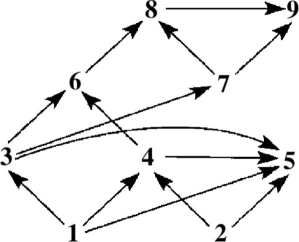 Figure 42.2 Diagram of a food web (arrows represent energy flow and numbers represent species)
-If Figure 42.2 represents a marine food web, the smallest organism might be
Figure 42.2 Diagram of a food web (arrows represent energy flow and numbers represent species)
-If Figure 42.2 represents a marine food web, the smallest organism might be
(Multiple Choice)
4.8/5 (36)
Filters
- Essay(0)
- Multiple Choice(0)
- Short Answer(0)
- True False(0)
- Matching(0)