Exam 6: Quality and Process Improvement
Exam 1: Creating Customer Value Through Operations92 Questions
Exam 2: Supply Chain Management100 Questions
Exam 3: Process Configuration114 Questions
Exam 4: Capacity101 Questions
Exam 5: Inventory Management152 Questions
Exam 6: Quality and Process Improvement197 Questions
Exam 7: Lean Systems158 Questions
Exam 8: Managing Projects152 Questions
Exam 9: Location and Layout197 Questions
Exam 10: Managing Demand and Forecasting139 Questions
Exam 11: Operations Planning and Scheduling123 Questions
Exam 12: Resource Planning151 Questions
Exam 13: Waiting Lines93 Questions
Exam 14: Decision Making73 Questions
Exam 15: Financial Analysis41 Questions
Exam 16: Work Measurement97 Questions
Exam 17: Learning Curve Analysis44 Questions
Exam 18: Computer-Integrated Manufacturing53 Questions
Exam 19: Acceptance Sampling Plans71 Questions
Exam 20: Simulation36 Questions
Exam 21: Special Inventory Models32 Questions
Exam 22: Linear Programming47 Questions
Select questions type
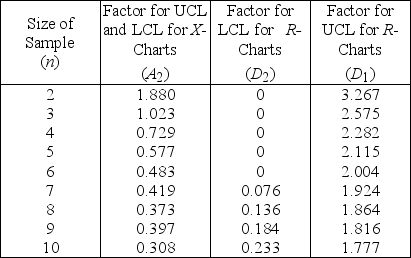
Table 6.1
Factors for Calculating Three-Sigma Limits for the  -chart and R-chart
 Source: 1950 Manual on Quality Control of Materials,copyright
American Society for Testing Materials.Reprinted with permission.
-A milling operation has historically produced an average thickness of 0.005 inch with an average range of 0.015 inch.Currently,the first three items from each batch of 20 are inspected.Use Table 6.1.What is the value of the LCL
Source: 1950 Manual on Quality Control of Materials,copyright
American Society for Testing Materials.Reprinted with permission.
-A milling operation has historically produced an average thickness of 0.005 inch with an average range of 0.015 inch.Currently,the first three items from each batch of 20 are inspected.Use Table 6.1.What is the value of the LCL  ?
?
(Multiple Choice)
4.9/5  (33)
(33)
The implementation of a total quality management program will most likely result in a(n)
(Multiple Choice)
4.9/5 (40)
Table 6.3
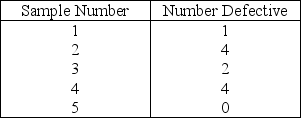 -Samples of 100 checks each were taken at a bank from an encoding machine (which records the amount of a check)over a five-day period.Details are summarized in the Table 6.3.If the bank were to use the average proportion defective from these five samples as the central line for a process control chart,what would be the central line?
(Multiple Choice)
4.7/5 (40)
Which one of the following techniques will help management trace customer complaints directly to the operations involved?
(Multiple Choice)
4.9/5 (46)
In applying quality control charts,a sample statistic that falls outside the UCL and LCL indicates the process is exhibiting common causes of variation.
(True/False)
4.9/5 (44)
A product has five major components with individual reliabilities of 0.95,0.98,0.97,0.98,and 0.99.What is the reliability of the product?
(Multiple Choice)
4.9/5 (37)
Which one of the following statements is most consistent with the concept of total quality management?
(Multiple Choice)
4.8/5 (31)
Deming argued that the vast majority of quality problems can be attributed to managers or the systems they put in place,not with the employees that must do their work according to these systems.
(True/False)
4.9/5 (34)
Firms should avoid having errors or defects caught and corrected at the source.
(True/False)
4.9/5 (38)
Historically,the average time to service a customer complaint has been 3 days and the standard deviation has been 0.50 day.Management would like to specify the control limits for an  -chart with a sample size of 10 and 3 sigma limits.The LCL for the chart would be
(Multiple Choice)
5.0/5 (35)
Customers assess quality solely on the basis of how goods and services conform to design specifications and associated operating characteristics.
(True/False)
4.9/5 (26)
Historically,the average proportion of defective bars has been 0.015.Samples will be of 100 bars each.Construct a p-chart using z = 3.What is the value of UCL?
(Multiple Choice)
4.9/5 (32)
Historically,the average time to service a customer complaint has been 3 days and the standard deviation has been 0.50 day.Management would like to specify the control limits for an  -chart with a sample size of 10 and 3 sigma limits.Suppose the next sample of 10 yielded the following result: 3.2,2.1,3.6,2.8,3.9,3.5,2.7,4.1,2.6,and 3.3.What conclusion can be drawn?
(Multiple Choice)
4.9/5 (33)
The central line on a p-chart is 0.50 with an UCL of 0.65 and a LCL of 0.35.The results of the next six samples are 0.60,0.37,0.45,0.48,0.53,and 0.62.What should you do?
(Multiple Choice)
4.9/5 (40)
One function of control charts for variables is to monitor the mean of the process distribution.
(True/False)
4.7/5 (37)
Appraisal costs are associated with preventing defects before they happen.
(True/False)
4.8/5 (33)
________ teams address issues of paramount concern to management,labor,or both.
(Essay)
4.8/5 (32)
Filters
- Essay(0)
- Multiple Choice(0)
- Short Answer(0)
- True False(0)
- Matching(0)