Exam 12: Monetary Policy and the Phillips Curve
Exam 1: Introduction to Macroeconomics35 Questions
Exam 2: Measuring the Macroeconomy114 Questions
Exam 3: An Overview of Long-Run Economic Growth110 Questions
Exam 4: A Model of Production129 Questions
Exam 5: The Solow Growth Model126 Questions
Exam 6: Growth and Ideas120 Questions
Exam 7: The Labor Market, Wages, and Unemployment119 Questions
Exam 8: Inflation117 Questions
Exam 9: An Introduction to the Short Run113 Questions
Exam 10: The Great Recession: a First Look108 Questions
Exam 11: The Is Curve128 Questions
Exam 12: Monetary Policy and the Phillips Curve135 Questions
Exam 13: Stabilization Policy and the Asad Framework113 Questions
Exam 14: The Great Recession and the Short-Run Model112 Questions
Exam 15: Dsge Models: the Frontier of Business Cycle Research119 Questions
Exam 16: Consumption109 Questions
Exam 17: Investment116 Questions
Exam 18: The Government and the Macroeconomy122 Questions
Exam 19: International Trade107 Questions
Exam 20: Exchange Rates and International Finance142 Questions
Exam 21: Parting Thoughts35 Questions
Select questions type
Refer to the following figure when answering the following questions.
Figure 12.11: Change in Inflation by Month 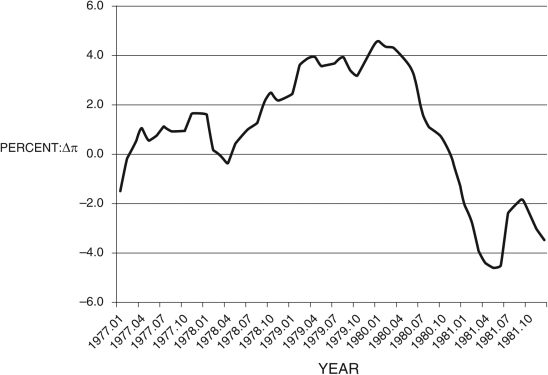 -Consider Figure 12.11. You are Federal Reserve chairman Volcker and today's date is mid-1977. You suggest the appropriate policy would be to ________. You reevaluate your policy in mid-1979 and conclude that you ________; using the Phillips curve, you see the country is now in ________.
(Multiple Choice)
4.9/5  (28)
(28)
In most advanced economies, central banks target ________ to conduct monetary policy.
(Multiple Choice)
4.9/5 (38)
With adaptive expectations, the Phillips curve can be written as:
(Multiple Choice)
4.8/5 (33)
Which of the following is the mission of the Federal Reserve Bank?
i. Preserve price stability
ii. Foster economic growth and employment
iii. Ensure taxes are fair
(Multiple Choice)
4.9/5 (34)
Which of the following is the mission of the Federal Reserve Bank?
i. Preserve price stability
ii. Foster stable fiscal policy
iii. Ensure taxes are fair
(Multiple Choice)
4.8/5 (36)
Refer to the following figure when answering the following questions.
Figure 12.2: IS-MP Curve 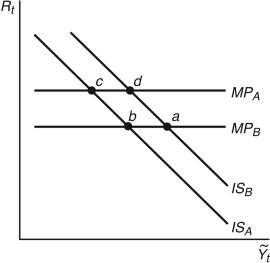 -Consider Figure 12.2. If the stock market drops sharply, there is a loss in consumer and investor confidence and the economy moves from point ________. To prevent a ________, the Fed ________, and the economy moves from point ________.
(Multiple Choice)
4.7/5 (40)
The term structure of interest rates is a way of looking at bond rates with different maturity periods.
(True/False)
4.9/5 (27)
What is the main policy tool available to the Federal Reserve?
(Multiple Choice)
4.9/5 (31)
Refer to the following figure when answering the following questions.
Figure 12.12: Money Market 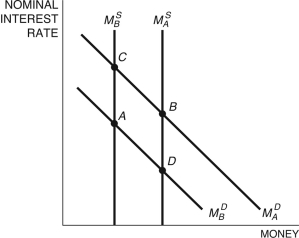 -Starting at any equilibrium in Figure 12.12, if the Fed loosens money, the money market would move from point:
(Multiple Choice)
4.8/5 (36)
You have been asked to spend a week or so as the Fed chairman. It will turn out to be a very interesting week. If your goal is to stabilize inflation and economic activity, what would be your response to the following three events? Consider each event individually, independent from the others:
(a) a rapid rise in the stock markets rapidly increases people's wealth;
(b) Chilean citizens get a sudden taste for Buffalo hot wings (they must be made in Buffalo); and
(c) firms begin to grow anxious about the decline in consumer confidence.
(Essay)
4.8/5 (42)
Which of the following scenarios best describes the short-run model?
(Multiple Choice)
4.8/5 (45)
When the Federal Reserve increases the interest rate, the MP curve shifts up and potential output falls.
(True/False)
4.8/5 (45)
Refer to the following figure when answering the following questions.
Figure 12.10: Output Gap: 1990-2000 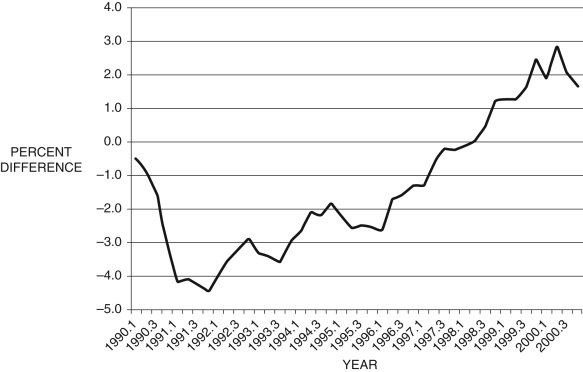 -Consider Figure 12.10, which shows the output gap
  from 1990 to 2000, by quarter. If this is all the information you have, during the period 1993.1-1993.4, from the Phillips curve, you would conclude that:
(Multiple Choice)
4.7/5 (33)
"Adaptive expectations" implies that firms adjust their inflation expectations immediately.
(True/False)
4.8/5 (36)
The link between real and nominal interest rates is summarized in:
(Multiple Choice)
4.8/5 (36)
Refer to the following figure when answering the following questions.
Figure 12.2: IS-MP Curve
-Consider Figure 12.2. If the Fed lowers interest rates and there are no aggregate demand shocks, the economy moves from point ________ to ________.
(Multiple Choice)
4.7/5 (42)
Filters
- Essay(0)
- Multiple Choice(0)
- Short Answer(0)
- True False(0)
- Matching(0)