Exam 12: Monetary Policy and the Phillips Curve
Exam 1: Introduction to Macroeconomics35 Questions
Exam 2: Measuring the Macroeconomy114 Questions
Exam 3: An Overview of Long-Run Economic Growth110 Questions
Exam 4: A Model of Production129 Questions
Exam 5: The Solow Growth Model126 Questions
Exam 6: Growth and Ideas120 Questions
Exam 7: The Labor Market, Wages, and Unemployment119 Questions
Exam 8: Inflation117 Questions
Exam 9: An Introduction to the Short Run113 Questions
Exam 10: The Great Recession: a First Look108 Questions
Exam 11: The Is Curve128 Questions
Exam 12: Monetary Policy and the Phillips Curve135 Questions
Exam 13: Stabilization Policy and the Asad Framework113 Questions
Exam 14: The Great Recession and the Short-Run Model112 Questions
Exam 15: Dsge Models: the Frontier of Business Cycle Research119 Questions
Exam 16: Consumption109 Questions
Exam 17: Investment116 Questions
Exam 18: The Government and the Macroeconomy122 Questions
Exam 19: International Trade107 Questions
Exam 20: Exchange Rates and International Finance142 Questions
Exam 21: Parting Thoughts35 Questions
Select questions type
In the text, inflation is given by the equation ________, where  is the current price level and
  is the future price level.
(Multiple Choice)
4.8/5  (26)
(26)
One of the main missions of the Federal Reserve is to stabilize the dollar-pound exchange rate.
(True/False)
5.0/5 (47)
What tool does the U.S. Federal Reserve use to conduct policy? Explain. How does monetary policy impact the macroeconomy?
(Essay)
4.9/5 (40)
When a central bank targets interest rates, it adopts a policy to adjust ________ to accommodate ________.
(Multiple Choice)
4.9/5 (36)
As lender in the last resort, the Fed loans money to banks at:
(Multiple Choice)
4.8/5 (34)
Which of the following contributed to high levels of inflation in the 1970s?
i. Oil price shocks
ii. Lower taxes
iii. A productivity slowdown
(Multiple Choice)
4.8/5 (37)
When the Federal Reserve increases the interest rate, the MP curve shifts up and short-term output falls.
(True/False)
4.8/5 (35)
Consider Figure 12.14 below, which shows the price of oil from January 2005-December 2010. What are the impacts of this on the macroeconomy? In particular, which macroeconomic relationship does this impact? Explain.Figure 12.14: Percent Change Oil Price 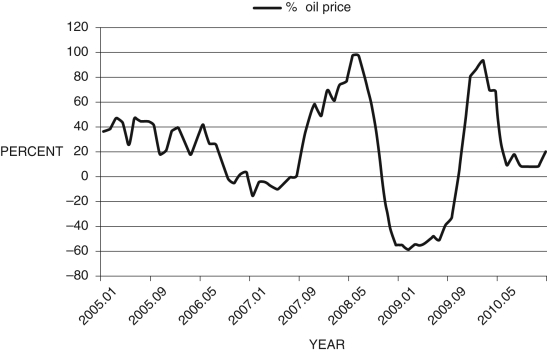
(Essay)
4.9/5 (43)
Refer to the following figure when answering the following questions.
Figure 12.2: IS-MP Curve 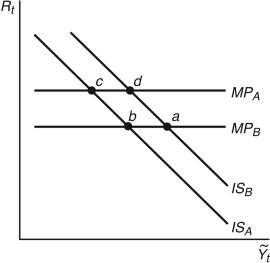 -Consider Figure 12.2. If the Fed raises interest rates and there are no aggregate demand shocks, the economy moves from:
(Multiple Choice)
4.8/5 (36)
Economists who study monetary policy believe that it takes anywhere from ________ for monetary policy to have a substantial effect on economic activity.
(Multiple Choice)
4.8/5 (32)
The real interest rate is given by Real interest rate = Nominal interest rate+ Inflation.
(True/False)
4.7/5 (46)
According to the Phillips curve, if current output is above potential output:
(Multiple Choice)
4.8/5 (49)
Filters
- Essay(0)
- Multiple Choice(0)
- Short Answer(0)
- True False(0)
- Matching(0)