Exam 12: Monetary Policy and the Phillips Curve
Exam 1: Introduction to Macroeconomics35 Questions
Exam 2: Measuring the Macroeconomy114 Questions
Exam 3: An Overview of Long-Run Economic Growth110 Questions
Exam 4: A Model of Production129 Questions
Exam 5: The Solow Growth Model126 Questions
Exam 6: Growth and Ideas120 Questions
Exam 7: The Labor Market, Wages, and Unemployment119 Questions
Exam 8: Inflation117 Questions
Exam 9: An Introduction to the Short Run113 Questions
Exam 10: The Great Recession: a First Look108 Questions
Exam 11: The Is Curve128 Questions
Exam 12: Monetary Policy and the Phillips Curve135 Questions
Exam 13: Stabilization Policy and the Asad Framework113 Questions
Exam 14: The Great Recession and the Short-Run Model112 Questions
Exam 15: Dsge Models: the Frontier of Business Cycle Research119 Questions
Exam 16: Consumption109 Questions
Exam 17: Investment116 Questions
Exam 18: The Government and the Macroeconomy122 Questions
Exam 19: International Trade107 Questions
Exam 20: Exchange Rates and International Finance142 Questions
Exam 21: Parting Thoughts35 Questions
Select questions type
Figure 12.8: Output 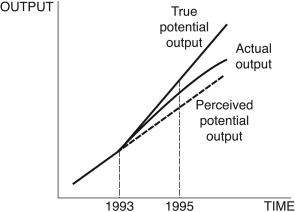 -Consider Figure 12.8. You are chairman of the Federal Reserve in 1995. You believe potential output follows the dotted line after 1993, but in actuality, it follows the line denoted "True potential output." The current state of the economy is given by the curve "Actual output." Given the information in the figure, you ________, because you believe the economy is in a ________, but your advice instead ________.
(Multiple Choice)
4.9/5  (30)
(30)
According to the Fisher equation, the nominal interest rate is equal to the:
(Multiple Choice)
4.9/5 (40)
Refer to the following figure when answering the following questions.
Figure 12.12: Money Market 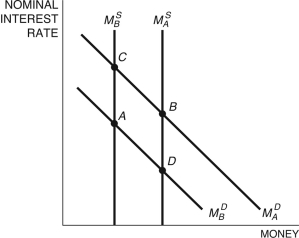 -Starting at any equilibrium in Figure 12.12, if the Fed tightens money, the money market would move from point:
(Multiple Choice)
4.8/5 (44)
Discuss the differences between the ex ante and ex post real interest rate.
(Essay)
4.8/5 (35)
Refer to the following figure when answering the following questions.
Figure 12.2: IS-MP Curve 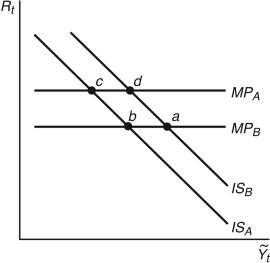 -Consider Figure 12.2. If housing prices drop sharply, there is a loss in consumer and investor confidence and the economy moves from point ________. To prevent a ________, the Fed ________, and the economy moves from point ________.
(Multiple Choice)
4.9/5 (39)
The Phillips curve assumes inflation expectations are rational.
(True/False)
4.8/5 (40)
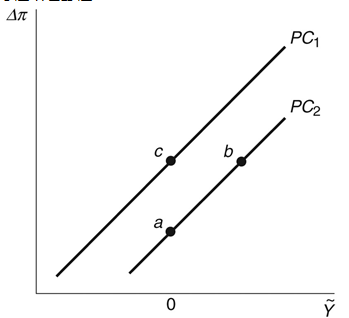
Refer to the following figure when answering the following questions.
Figure 12.5: Phillips Curve
 -When the dot-com bubble burst, it pushed the economy toward a recession. Using the IS/MP diagram, design a monetary policy that would return the economy back to the long-run equilibrium.
(Essay)
4.9/5 (32)
Figure 12.20: Change in Inflation ( ): 1977-1982 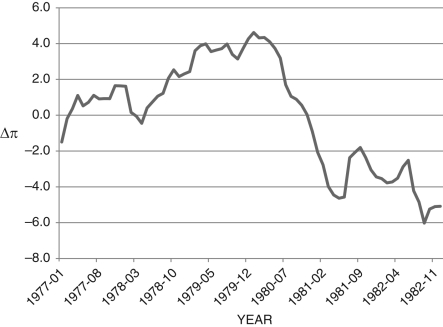 -Consider Figure 12.20, which shows the change in inflation from 1977-1982. If you are the Fed chairman during this period, G. William Miller (1978-1979) and Paul Volcker (1979-1987), what is your primary concern during the periods of, roughly, 1978-1980 and 1982? What would you do to remedy this situation? What curve are you likely to consider when you make your policy decision?
(Essay)
5.0/5 (38)
Figure 12.6: IS-MP Curve 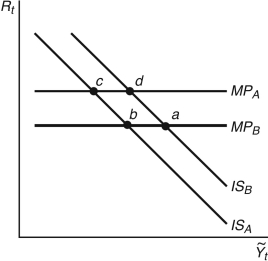 -Start from any equilibrium in Figure 12.6 to answer the following question. In 1980, U.S. inflation hit about 14 percent; Federal Reserve chairman ________ engineered a decline in inflation by ________ rates, shown in the figure as movement from point ________.
(Multiple Choice)
4.9/5 (42)
The money demand curve slopes upward with respect to the nominal interest rate.
(True/False)
4.9/5 (38)
Recent energy legislation that dictates increased use of ethanol as automobile fuel might ________ overall inflation because corn prices will ________, affecting all downstream industries that use corn as a(n) ________.
(Multiple Choice)
4.8/5 (40)
Figure 12.13 shows the yield curve for December 4, 2006. What is notable about this yield curve? 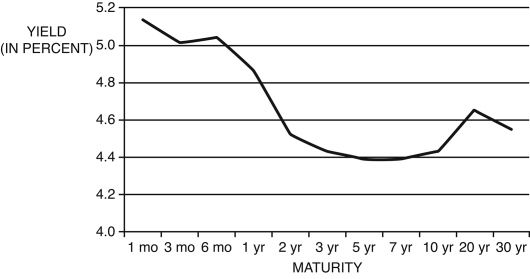 (Source: U.S. Department of the Treasury)
(Essay)
4.7/5 (42)
Figure 12.1: MP Curve 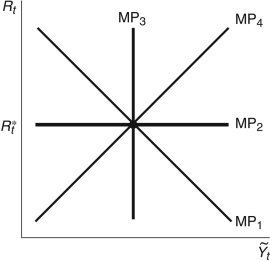 -In Figure 12.1, if the Federal Reserve sets the real interest rate at
  , which line represents the MP curve?
(Multiple Choice)
4.9/5 (34)
If we replace the actual rate of inflation with the expected inflation rate in the Fisher equation, we get the:
(Multiple Choice)
4.9/5 (35)
Refer to the following figure when answering the following questions.
Figure 12.2: IS-MP Curve
-Consider Figure 12.2. If there is a sharp increase in consumer confidence, the economy moves from point ________. To prevent a ________, the Fed ________, and the economy moves from point ________.
(Multiple Choice)
4.9/5 (40)
If prices are sticky and there are no aggregate demand shocks, and if the Fed raises the interest rate, ________ and ________.
(Multiple Choice)
4.8/5 (39)
In March and April 1980, inflation in the United States peaked at 14.6 percent. What did then-Fed chairman Volcker elect to do? What was the impact of his policy?
(Essay)
4.9/5 (34)
Refer to the following figure when answering the following questions.
Figure 12.3: Yield Curves December 4, 2006 and 2012 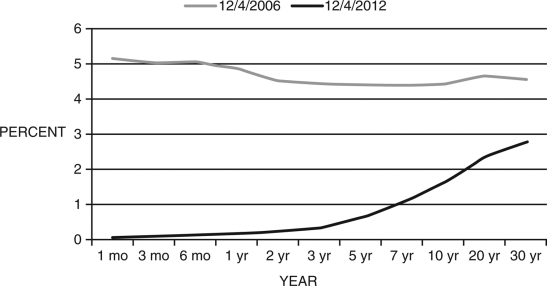 -Consider the yield curves in Figure 12.3. The curve for 12/4/2006 is unusual because:
(Multiple Choice)
4.9/5 (36)
Filters
- Essay(0)
- Multiple Choice(0)
- Short Answer(0)
- True False(0)
- Matching(0)