Exam 12: Monetary Policy and the Phillips Curve
Exam 1: Introduction to Macroeconomics35 Questions
Exam 2: Measuring the Macroeconomy114 Questions
Exam 3: An Overview of Long-Run Economic Growth110 Questions
Exam 4: A Model of Production129 Questions
Exam 5: The Solow Growth Model126 Questions
Exam 6: Growth and Ideas120 Questions
Exam 7: The Labor Market, Wages, and Unemployment119 Questions
Exam 8: Inflation117 Questions
Exam 9: An Introduction to the Short Run113 Questions
Exam 10: The Great Recession: a First Look108 Questions
Exam 11: The Is Curve128 Questions
Exam 12: Monetary Policy and the Phillips Curve135 Questions
Exam 13: Stabilization Policy and the Asad Framework113 Questions
Exam 14: The Great Recession and the Short-Run Model112 Questions
Exam 15: Dsge Models: the Frontier of Business Cycle Research119 Questions
Exam 16: Consumption109 Questions
Exam 17: Investment116 Questions
Exam 18: The Government and the Macroeconomy122 Questions
Exam 19: International Trade107 Questions
Exam 20: Exchange Rates and International Finance142 Questions
Exam 21: Parting Thoughts35 Questions
Select questions type
Refer to the following figure when answering the following questions.
Figure 12.9: Change in Inflation by Quarter 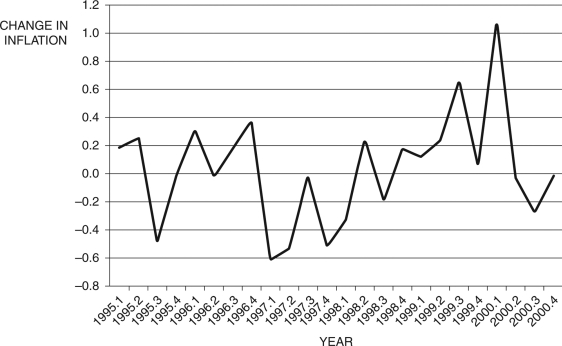 -Consider Figure 12.9. You are Federal Reserve chairman Greenspan and today's date is the second quarter of 1997 (1997.2). Given the information you have, using the Phillips curve, to stabilize the economy you would ________ interest rates, risking ________.
(Multiple Choice)
4.9/5  (34)
(34)
Refer to the following figure when answering the following questions.
Figure 12.2: IS-MP Curve 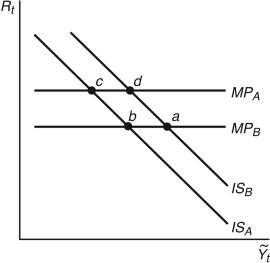 -Consider Figure 12.2. If the Fed lowers interest rates and there are no aggregate demand shocks, the economy moves from point ________ to ________.
(Multiple Choice)
4.8/5 (39)
Refer to the following figure when answering the following questions.
Figure 12.11: Change in Inflation by Month 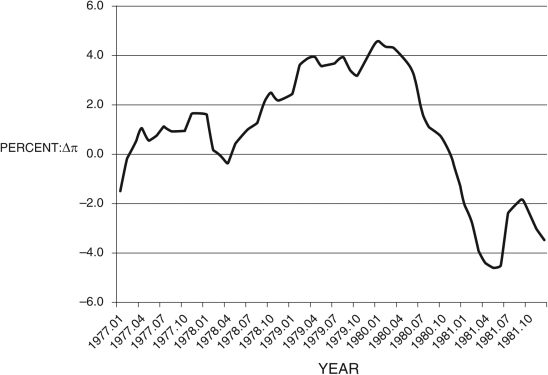 -Consider Figure 12.11. You are Federal Reserve chairman Volcker and today's date is the first quarter of 1980 (1980.1). You suggest the appropriate policy would be to ________. In the second quarter of 1981, you consider your performance, and you conclude that you ________; using the Phillips curve, you see the country is now ________.
(Multiple Choice)
4.7/5 (38)
What is the main policy tool available to the Federal Reserve?
(Multiple Choice)
4.9/5 (34)
According to the Phillips curve, if current output equals potential output:
(Multiple Choice)
4.8/5 (42)
Between 2009 and 2015, the federal funds rate was roughly equal to:
(Multiple Choice)
4.7/5 (43)
In the Phillips curve, the term ________ reflects ________.
(Multiple Choice)
4.8/5 (31)
The Phillips curve assumes that inflation expectations are:
(Multiple Choice)
4.8/5 (42)
Based on the reasoning of the original version of the Phillips curve, conventional wisdom of the 1960s was that:
(Multiple Choice)
4.9/5 (39)
Figure 12.16: Output 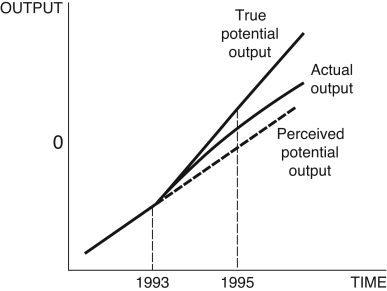 -Consider Figure 12.16. Explain how misunderstanding potential real GDP can lead to the wrong monetary policy.
(Essay)
4.8/5 (33)
According to the quantity theory of money, an increase in GDP ________ inflation, and the Phillips curve demonstrates that inflation ________ with rising GDP. This is because the quantity theory is a ________ theory of price behavior.
(Multiple Choice)
4.9/5 (34)
Refer to the following figure when answering the following questions.
Figure 12.10: Output Gap: 1990-2000 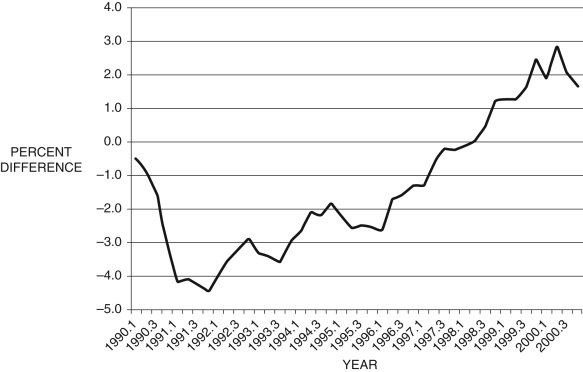 -Consider Figure 12.10, which shows the output gap
  from 1990 to 2000, by quarter. If this is all the information you have, during the period 1997.1-1999.4, from the Phillips curve, you would conclude that:
(Multiple Choice)
4.8/5 (35)
Figure 12.19: Change in Inflation ( ): 2007-2012 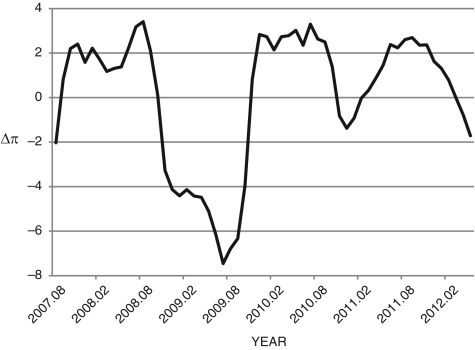 -Consider Figure 12.19, which shows the change in inflation from 2007.08-2012.05. If you are Ben Bernanke, Fed chairman, during this period, what is your primary concern during the period, roughly, 2008.08-2009.12? What would you do to remedy this situation? What curve are you likely to consider when you make your policy decision?
(Essay)
4.8/5 (35)
One of the remarkable things about the 2001 recession was the:
(Multiple Choice)
4.8/5 (35)
In the Phillips curve,  represents a change in government spending.
(True/False)
5.0/5 (30)
Filters
- Essay(0)
- Multiple Choice(0)
- Short Answer(0)
- True False(0)
- Matching(0)