Exam 26: Vehicle Routing and Scheduling
Exam 1: Operations and Productivity126 Questions
Exam 2: Operations Strategy in a Global Environment135 Questions
Exam 3: Project Management123 Questions
Exam 4: Forecasting142 Questions
Exam 5: Design of Goods and Services137 Questions
Exam 6: Managing Quality130 Questions
Exam 7: Process Strategy129 Questions
Exam 8: Location Strategies140 Questions
Exam 9: Layout Strategies161 Questions
Exam 10: Human Resources, Job Design, and Work Measurement191 Questions
Exam 11: Supply-Chain Management145 Questions
Exam 12: Inventory Management171 Questions
Exam 13: Aggregate Planning134 Questions
Exam 14: Material Requirements Planning Mrp and Erp172 Questions
Exam 15: Short-Term Scheduling139 Questions
Exam 16: Just-In-Time and Lean Options138 Questions
Exam 17: Maintenance and Reliability130 Questions
Exam 18: Statistical Tools for Managers97 Questions
Exam 19: Acceptance Sampling99 Questions
Exam 20: The Simplex Method of Linear Programming94 Questions
Exam 21: The Modi and Vam Methods of Solving Transportation Problems135 Questions
Exam 22: Vehicle Routing and Scheduling111 Questions
Exam 23 Managing Quality155 Questions
Exam 24: Process Strategy107 Questions
Exam 25: Supply-Chain Management73 Questions
Exam 26: Vehicle Routing and Scheduling92 Questions
Select questions type
Monte Carlo simulations applied to queuing problems have what advantage?
(Multiple Choice)
4.9/5  (28)
(28)
A(n) __________ is the accumulation of individual probabilities of a distribution.
(Short Answer)
4.7/5 (44)
A distribution of service times at a waiting line indicates that service takes 12 minutes 30 percent of the time and 14 minutes 70 percent of the time. Prepare the probability distribution, the cumulative probability distribution, and the random number intervals for this problem. The first six random numbers were 99, 29, 27, 75, 89, and 78. What is the average service time for this simulation run?
(Essay)
4.8/5 (38)
Which of the following are advantages to simulation? I. Time compression
II. What-if questions are possible
III. Flexibility
IV. Trial and Error approach
V. Input must be user generated
(Multiple Choice)
4.9/5 (37)
Provide a small example illustrating how random numbers are used in Monte Carlo simulation.
(Essay)
4.7/5 (37)
Explain what is meant by the concept of "time compression" in simulation modeling.
(Essay)
4.9/5 (34)
The Las Vegas method is a simulation technique that uses random elements when chance exists in their behavior.
(True/False)
4.9/5 (39)
Simulation is usually capable of producing a more appropriate answer to a complex problem than can be obtained from a mathematical model.
(True/False)
4.8/5 (33)
A(n) __________ is a series of digits that have been selected by a totally random process.
(Short Answer)
4.9/5 (40)
A distribution of service times at a waiting line shows that service takes 6 minutes 40 percent of the time, 7 minutes 30 percent of the time, 8 minutes 20 percent of the time, and 9 minutes 10 percent of the time. Prepare the probability distribution, the cumulative probability distribution, and the random number intervals for this problem. The first five random numbers are 37, 69, 53, 80, and 60. What is the average service time of this simulation run?
(Essay)
4.8/5 (32)
Identify, in order, the five steps required to implement the Monte Carlo simulation technique.
(Essay)
4.9/5 (38)
Which of the following is not an application of simulation in the area of operations?
(Multiple Choice)
4.8/5 (40)
A distribution of service times at a waiting line shows that service takes 6 minutes 40 percent of the time, 7 minutes 30 percent of the time, 8 minutes 20 percent of the time, and 9 minutes 10 percent of the time. Prepare the probability distribution, the cumulative probability distribution, and the random number intervals for this problem.
(Essay)
4.8/5 (26)
The number of tires sold at a car garage varies randomly between 0 and 4 each hour. What set of random numbers (on the 1-100 scale would tire sales of 2 be assigned?
(Multiple Choice)
4.8/5 (36)
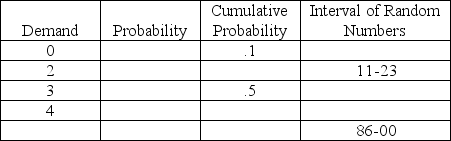
Complete the following table in preparation for a Monte Carlo simulation. The expected demand is 3.52.
(Essay)
4.9/5 (34)
The lunch counter at a small restaurant has difficulty handling the lunch business. Currently, there is only one cashier in a single-channel, single-phase system. The restaurant has collected information on the interarrival time, and service time distributions from past lunch hours. They are represented in the tables below. Use the following two-digit random numbers given below to simulate 10 customers through the checkout system. What is the average time in line, and average time in system? (Set first arrival time to the interarrival time generated by first random number.
 Random numbers for interarrival times: 32, 73, 41, 38, 73, 01, 09, 64, 34, 44
Random numbers of service times: 84, 55, 25, 71, 34, 57, 50, 44, 95, 64
Random numbers for interarrival times: 32, 73, 41, 38, 73, 01, 09, 64, 34, 44
Random numbers of service times: 84, 55, 25, 71, 34, 57, 50, 44, 95, 64
(Essay)
4.8/5 (25)
The seven steps in the use of simulation include all but which of the following?
(Multiple Choice)
4.9/5 (33)
Filters
- Essay(0)
- Multiple Choice(0)
- Short Answer(0)
- True False(0)
- Matching(0)