Exam 14: Simple Linear Regression Analysis
Exam 1: An Introduction to Business Statistics and Analytics98 Questions
Exam 2: Descriptive Statistics and Analytics: Tabular and Graphical Methods120 Questions
Exam 3: Descriptive Statistics and Analytics: Numerical Methods145 Questions
Exam 4: Probability and Probability Models150 Questions
Exam 5: Predictive Analytics I: Trees, K-Nearest Neighbors, Naive Bayes,101 Questions
Exam 6: Discrete Random Variables150 Questions
Exam 7: Continuous Random Variables150 Questions
Exam 8: Sampling Distributions111 Questions
Exam 9: Confidence Intervals149 Questions
Exam 10: Hypothesis Testing150 Questions
Exam 11: Statistical Inferences Based on Two Samples140 Questions
Exam 12: Experimental Design and Analysis of Variance132 Questions
Exam 13: Chi-Square Tests120 Questions
Exam 14: Simple Linear Regression Analysis147 Questions
Exam 15: Multiple Regression and Model Building85 Questions
Exam 16: Predictive Analytics Ii: Logistic Regression, Discriminate Analysis,101 Questions
Exam 17: Time Series Forecasting and Index Numbers161 Questions
Exam 18: Nonparametric Methods103 Questions
Exam 19: Decision Theory90 Questions
Select questions type
An experiment was performed on a certain metal to determine if the strength is a function of heating time. The 95 percent confidence interval for the average strength of a metal sheet when the average heating time is 4 minutes is from 4.325 to 5.675. Therefore, we are confident at α = .05 that the average strength of this metal heated for four minutes is between 4.325 and 5.675 pounds per square inch. Do you agree or disagree with this statement?
(Short Answer)
4.8/5  (38)
(38)
An experiment was performed on a certain metal to determine if the strength is a function of heating time. Results based on 10 metal sheets are given below.
∑X = 30
∑X2 = 104
∑Y = 40
∑Y2 = 178
∑XY = 134
Using the simple linear regression model, find the estimated y-intercept.
(Short Answer)
4.7/5 (36)
When using simple regression analysis, if there is a strong correlation between the independent and dependent variables, then we can conclude that an increase in the value of the independent variable causes an increase in the value of the dependent variable.
(True/False)
4.8/5 (32)
A local tire dealer wants to predict the number of tires sold each month. He believes that the number of tires sold is a linear function of the amount of money invested in advertising. He randomly selects 6 months of data consisting of tire sales (in thousands of tires) and advertising expenditures (in thousands of dollars). Based on the data set with 6 observations, the simple linear regression equation of the least squares line is ŷ = 3 + 1x.
∑X = 24
∑X2 = 124
∑Y = 42
∑Y2 = 338
∑XY = 196
MSE = 4
Using the sums of the squares given above, determine the 90 percent prediction interval for tire sales in a month when the advertising expenditure is $5,000.
(Short Answer)
4.8/5 (29)
Regression Analysis
 ANOVA
ANOVA
 Regression output
 A local grocery store wants to predict its daily sales in dollars. The manager believes that the amount of newspaper advertising significantly affects sales. He randomly selects 7 days of data consisting of daily grocery store sales (in thousands of dollars) and advertising expenditures (in thousands of dollars). The Excel/MegaStat output given above summarizes the results of the regression model.
At a significance level of .05, test the significance of the slope and state your conclusion.
A local grocery store wants to predict its daily sales in dollars. The manager believes that the amount of newspaper advertising significantly affects sales. He randomly selects 7 days of data consisting of daily grocery store sales (in thousands of dollars) and advertising expenditures (in thousands of dollars). The Excel/MegaStat output given above summarizes the results of the regression model.
At a significance level of .05, test the significance of the slope and state your conclusion.
(Short Answer)
4.8/5 (34)
An experiment was performed on a certain metal to determine if the strength is a function of heating time. Results based on 10 metal sheets are given below. Use the simple linear regression model.
∑X = 30
∑X2 = 104
∑Y = 40
∑Y2 = 178
∑XY = 134
Determine the standard error.
(Short Answer)
4.9/5 (35)
Consider the following partial computer output from a simple linear regression analysis.
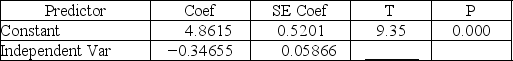 S = .4862R-Sq = ________
Analysis of Variance
S = .4862R-Sq = ________
Analysis of Variance
 Write the equation of the least squares line.
(Short Answer)
4.9/5 (32)
A local tire dealer wants to predict the number of tires sold each month. He believes that the number of tires sold is a linear function of the amount of money invested in advertising. He randomly selects 6 months of data consisting of tire sales (in thousands of tires) and advertising expenditures (in thousands of dollars). Based on the data set with 6 observations, the simple linear regression equation of the least squares line is ŷ = 3 + 1x.
∑X = 24
∑X2 = 124
∑Y = 42
∑Y2 = 338
∑XY = 196
MSE = 4
Using the sums of the squares given above, determine the 90 percent confidence interval for the mean value of monthly tire sales when the advertising expenditure is $5,000.
(Short Answer)
4.9/5 (27)
Consider the following partial computer output from a simple linear regression analysis.
 R2.9722
Test H0: β1 ≤ 0 vs. Ha: β1 > 0.
R2.9722
Test H0: β1 ≤ 0 vs. Ha: β1 > 0.
(Short Answer)
4.9/5 (46)
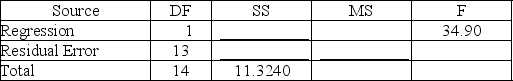
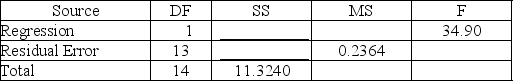
Complete the following partial ANOVA table from a simple linear regression analysis with a sample size of 16 observations. Find the F statistic to test the significance of the model at
alpha = .05.

(Short Answer)
4.9/5 (33)
A local tire dealer wants to predict the number of tires sold each month. He believes that the number of tires sold is a linear function of the amount of money invested in advertising. He randomly selects 6 months of data consisting of tire sales (in thousands of tires) and advertising expenditures (in thousands of dollars). Based on the data set with 6 observations, the simple linear regression model yielded the following results.
∑X = 24
∑X2 = 124
∑Y = 42
∑Y2 = 338
∑XY = 196
Determine the value of the estimated y-intercept.
(Short Answer)
4.8/5 (36)
The notation Ŷ refers to the average value of the dependent variable Y.
(True/False)
4.8/5 (29)
A local tire dealer wants to predict the number of tires sold each month. He believes that the number of tires sold is a linear function of the amount of money invested in advertising. He randomly selects 6 months of data consisting of monthly tire sales (in thousands of tires) and monthly advertising expenditures (in thousands of dollars). Residuals are calculated for all of the randomly selected six months and ordered from smallest to largest. Determine the normal score for the smallest residual.
(Short Answer)
4.9/5 (36)
The experimental region is the range of the previously observed values of the dependent variable.
(True/False)
4.7/5 (34)
Consider the following partial computer output from a simple linear regression analysis.
 R2.9722
Calculate the correlation coefficient.
R2.9722
Calculate the correlation coefficient.
(Short Answer)
4.7/5 (32)
Regression Analysis
 ANOVA
ANOVA
 Regression output
 A local grocery store wants to predict its daily sales in dollars. The manager believes that the amount of newspaper advertising significantly affects sales. He randomly selects 7 days of data consisting of daily grocery store sales (in thousands of dollars) and advertising expenditures (in thousands of dollars). The Excel/MegaStat output given above summarizes the results of the regression model.
What is the value of the simple coefficient of determination?
A local grocery store wants to predict its daily sales in dollars. The manager believes that the amount of newspaper advertising significantly affects sales. He randomly selects 7 days of data consisting of daily grocery store sales (in thousands of dollars) and advertising expenditures (in thousands of dollars). The Excel/MegaStat output given above summarizes the results of the regression model.
What is the value of the simple coefficient of determination?
(Short Answer)
4.8/5 (43)
Consider the following partial computer output from a simple linear regression analysis.
 S = .4862R-Sq = ________
Analysis of Variance
S = .4862R-Sq = ________
Analysis of Variance
 What is the unexplained variance?
(Short Answer)
4.7/5 (33)
Use the least squares regression equation ŷ = 12.36 + 4.745X and determine the predicted value of y when x = 3.25.
(Short Answer)
4.9/5 (37)
All of the following are assumptions of the error terms in the simple linear regression model except
(Multiple Choice)
4.8/5 (43)
An experiment was performed on a certain metal to determine if the strength is a function of heating time. Results based on 10 metal sheets are given below. Use the simple linear regression model.
∑X = 30
∑X2 = 104
∑Y = 40
∑Y2 = 178
∑XY = 134
Calculate the coefficient of determination.
(Short Answer)
4.9/5 (30)
Filters
- Essay(0)
- Multiple Choice(0)
- Short Answer(0)
- True False(0)
- Matching(0)