Exam 14: Simple Linear Regression Analysis
Exam 1: An Introduction to Business Statistics and Analytics98 Questions
Exam 2: Descriptive Statistics and Analytics: Tabular and Graphical Methods120 Questions
Exam 3: Descriptive Statistics and Analytics: Numerical Methods145 Questions
Exam 4: Probability and Probability Models150 Questions
Exam 5: Predictive Analytics I: Trees, K-Nearest Neighbors, Naive Bayes,101 Questions
Exam 6: Discrete Random Variables150 Questions
Exam 7: Continuous Random Variables150 Questions
Exam 8: Sampling Distributions111 Questions
Exam 9: Confidence Intervals149 Questions
Exam 10: Hypothesis Testing150 Questions
Exam 11: Statistical Inferences Based on Two Samples140 Questions
Exam 12: Experimental Design and Analysis of Variance132 Questions
Exam 13: Chi-Square Tests120 Questions
Exam 14: Simple Linear Regression Analysis147 Questions
Exam 15: Multiple Regression and Model Building85 Questions
Exam 16: Predictive Analytics Ii: Logistic Regression, Discriminate Analysis,101 Questions
Exam 17: Time Series Forecasting and Index Numbers161 Questions
Exam 18: Nonparametric Methods103 Questions
Exam 19: Decision Theory90 Questions
Select questions type
If the Durbin-Watson statistic is less than dL, then we conclude that
(Multiple Choice)
4.9/5  (36)
(36)
If successive values of the residuals are close together, then there is a ________ autocorrelation and the value of the Durbin-Watson statistic is ________.
(Multiple Choice)
4.8/5 (31)
The least squares regression line minimizes the sum of the
(Multiple Choice)
4.8/5 (25)
When there is positive autocorrelation, over time, negative error terms are followed by positive error terms and positive error terms are followed by negative error terms.
(True/False)
4.9/5 (35)
A ________ measures the strength of the relationship between a dependent variable (Y) and an independent variable (X).
(Multiple Choice)
4.9/5 (33)
In a simple linear regression model, the slope term is the change in the mean value of y associated with ________ in x.
(Multiple Choice)
4.8/5 (35)
A simple linear regression model is an equation that describes the straight-line relationship between a dependent variable and an independent variable.
(True/False)
4.8/5 (36)
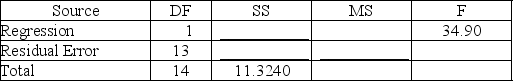
Consider the following partial computer output from a simple linear regression analysis.
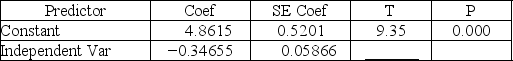 S = .4862R-Sq = ________
Analysis of Variance
S = .4862R-Sq = ________
Analysis of Variance
 What is the estimated y-intercept?
(Short Answer)
4.8/5 (27)
An experiment was performed on a certain metal to determine if the strength is a function of heating time. Partial results based on a sample of 10 metal sheets are given below. The simple linear regression equation is ŷ = 1 + 1X. The time is in minutes, the strength is measured in pounds per square inch, MSE = .5, Σx = 30, and Σx2 = 104. Determine the 95 percent confidence interval for the average strength of a metal sheet when the average heating time is 2.5 minutes.
(Short Answer)
4.8/5 (39)
When the assumption of ________ residuals (error terms) is violated, the Durbin-Watson statistic is used to test to determine if there is significant ________ among the residuals.
(Multiple Choice)
4.8/5 (33)
The range for r2 is between 0 and 1, and the range for r is between ________.
(Multiple Choice)
4.8/5 (31)
A data set with 7 observations yielded the following. Use the simple linear regression model.
∑X = 21.57
∑X2 = 68.31
∑Y = 188.9
∑Y2 = 5,140.23
∑XY = 590.83
SSE = 1.117
Determine the 95 percent confidence interval for the average value of Y when x = 3.25.
(Short Answer)
5.0/5 (38)
The estimated simple linear regression equation minimizes the sum of the squared deviations between each value of Y and the line.
(True/False)
4.8/5 (28)
The simple linear regression (least squares method) minimizes
(Multiple Choice)
4.9/5 (35)
Regression Analysis
 ANOVA
ANOVA
 Regression output
 A local grocery store wants to predict its daily sales in dollars. The manager believes that the amount of newspaper advertising significantly affects sales. He randomly selects 7 days of data consisting of daily grocery store sales (in thousands of dollars) and advertising expenditures (in thousands of dollars). The Excel/MegaStat output given above summarizes the results of the regression model.
What are the limits of the 95 percent confidence interval for the population slope?
A local grocery store wants to predict its daily sales in dollars. The manager believes that the amount of newspaper advertising significantly affects sales. He randomly selects 7 days of data consisting of daily grocery store sales (in thousands of dollars) and advertising expenditures (in thousands of dollars). The Excel/MegaStat output given above summarizes the results of the regression model.
What are the limits of the 95 percent confidence interval for the population slope?
(Short Answer)
5.0/5 (29)
The simple coefficient of determination is the proportion of total variation explained by the regression line.
(True/False)
4.9/5 (33)
Regression Analysis
 ANOVA
ANOVA
 Regression output
 A local grocery store wants to predict its daily sales in dollars. The manager believes that the amount of newspaper advertising significantly affects sales. He randomly selects 7 days of data consisting of daily grocery store sales (in thousands of dollars) and advertising expenditures (in thousands of dollars). The Excel/MegaStat output given above summarizes the results of the regression model.
If the manager decides to spend $3,000 on advertising, based on the simple linear regression results given above, what are the estimated sales?
A local grocery store wants to predict its daily sales in dollars. The manager believes that the amount of newspaper advertising significantly affects sales. He randomly selects 7 days of data consisting of daily grocery store sales (in thousands of dollars) and advertising expenditures (in thousands of dollars). The Excel/MegaStat output given above summarizes the results of the regression model.
If the manager decides to spend $3,000 on advertising, based on the simple linear regression results given above, what are the estimated sales?
(Short Answer)
4.9/5 (39)
In a simple linear regression model, the coefficient of determination not only indicates the strength of the relationship between the independent and dependent variables, but also shows whether the relationship is positive or negative.
(True/False)
4.9/5 (27)
The following results were obtained as part of a simple regression analysis. r2 = .9162
F statistic from the F table = 3.59
Calculated value of F from the ANOVA table = 81.87
Α = .05
P-value = .000
The null hypothesis of no linear relationship between the dependent variable and the independent variable
(Multiple Choice)
4.9/5 (36)
Consider the following partial computer output from a simple linear regression analysis.
 S = .4862R-Sq = ________
Analysis of Variance
S = .4862R-Sq = ________
Analysis of Variance
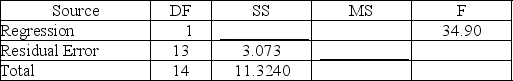 What is the coefficient of determination?
(Short Answer)
4.9/5 (25)
Filters
- Essay(0)
- Multiple Choice(0)
- Short Answer(0)
- True False(0)
- Matching(0)