Exam 14: Simple Linear Regression Analysis
Exam 1: An Introduction to Business Statistics and Analytics98 Questions
Exam 2: Descriptive Statistics and Analytics: Tabular and Graphical Methods120 Questions
Exam 3: Descriptive Statistics and Analytics: Numerical Methods145 Questions
Exam 4: Probability and Probability Models150 Questions
Exam 5: Predictive Analytics I: Trees, K-Nearest Neighbors, Naive Bayes,101 Questions
Exam 6: Discrete Random Variables150 Questions
Exam 7: Continuous Random Variables150 Questions
Exam 8: Sampling Distributions111 Questions
Exam 9: Confidence Intervals149 Questions
Exam 10: Hypothesis Testing150 Questions
Exam 11: Statistical Inferences Based on Two Samples140 Questions
Exam 12: Experimental Design and Analysis of Variance132 Questions
Exam 13: Chi-Square Tests120 Questions
Exam 14: Simple Linear Regression Analysis147 Questions
Exam 15: Multiple Regression and Model Building85 Questions
Exam 16: Predictive Analytics Ii: Logistic Regression, Discriminate Analysis,101 Questions
Exam 17: Time Series Forecasting and Index Numbers161 Questions
Exam 18: Nonparametric Methods103 Questions
Exam 19: Decision Theory90 Questions
Select questions type
The following time-sequenced observations of actual and predicted values of the dependent variable (demand) are obtained from a simple regression model. Determine the Durbin-Watson statistic (d).

(Short Answer)
4.9/5  (33)
(33)
Consider the following partial computer output from a simple linear regression analysis.
 S = .4862R-Sq = ________
Analysis of Variance
S = .4862R-Sq = ________
Analysis of Variance
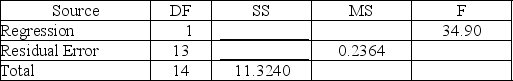 Calculate the SSE.
(Short Answer)
4.7/5 (30)
For the same value of X (independent variable), the confidence interval for the average value of Y (dependent variable) is ________ the prediction interval for the individual value of Y.
(Multiple Choice)
4.9/5 (31)
Consider the following partial computer output from a simple linear regression analysis.
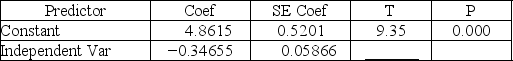 S = .4862R-Sq = ________
Analysis of Variance
S = .4862R-Sq = ________
Analysis of Variance
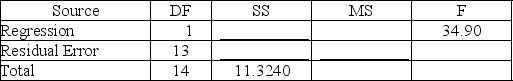 What is the predicted value of y when x = 9.00?
(Short Answer)
4.8/5 (35)
A local tire dealer wants to predict the number of tires sold each month. He believes that the number of tires sold is a linear function of the amount of money invested in advertising. He randomly selects 6 months of data consisting of tire sales (in thousands of tires) and advertising expenditures (in thousands of dollars). Based on the data set with 6 observations, the simple linear regression model yielded the following results.
∑X = 24
∑X2 = 124
∑Y = 42
∑Y2 = 338
∑XY = 196
Find the estimated slope.
(Short Answer)
4.7/5 (37)
What value of the Durbin-Watson statistic indicates that there is no autocorrelation present in time-ordered data?
(Multiple Choice)
4.8/5 (39)
The correlation coefficient is the ratio of explained variation to total variation.
(True/False)
4.8/5 (36)
Filters
- Essay(0)
- Multiple Choice(0)
- Short Answer(0)
- True False(0)
- Matching(0)