Exam 14: Simple Linear Regression Analysis
Exam 1: An Introduction to Business Statistics and Analytics98 Questions
Exam 2: Descriptive Statistics and Analytics: Tabular and Graphical Methods120 Questions
Exam 3: Descriptive Statistics and Analytics: Numerical Methods145 Questions
Exam 4: Probability and Probability Models150 Questions
Exam 5: Predictive Analytics I: Trees, K-Nearest Neighbors, Naive Bayes,101 Questions
Exam 6: Discrete Random Variables150 Questions
Exam 7: Continuous Random Variables150 Questions
Exam 8: Sampling Distributions111 Questions
Exam 9: Confidence Intervals149 Questions
Exam 10: Hypothesis Testing150 Questions
Exam 11: Statistical Inferences Based on Two Samples140 Questions
Exam 12: Experimental Design and Analysis of Variance132 Questions
Exam 13: Chi-Square Tests120 Questions
Exam 14: Simple Linear Regression Analysis147 Questions
Exam 15: Multiple Regression and Model Building85 Questions
Exam 16: Predictive Analytics Ii: Logistic Regression, Discriminate Analysis,101 Questions
Exam 17: Time Series Forecasting and Index Numbers161 Questions
Exam 18: Nonparametric Methods103 Questions
Exam 19: Decision Theory90 Questions
Select questions type
A regression model was applied to a data set with 8 time-ordered observations. The residuals for these observations are given below.
 Calculate the Durbin-Watson statistic (d).
(Short Answer)
4.8/5  (37)
(37)
The ________ of the simple linear regression model is the value of y when the mean value of x is zero.
(Multiple Choice)
4.9/5 (40)
For the same set of observations on a specified dependent variable, two different independent variables were used to develop two separate simple linear regression models. A portion of the results is presented below. 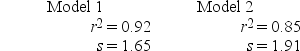 Based on the results given above, we can conclude that
(Multiple Choice)
4.9/5 (29)
In simple regression analysis, r2 is a percentage measure and measures the proportion of the variation explained by the simple linear regression model.
(True/False)
4.8/5 (38)
If there is significant autocorrelation present in a data set, the ________ assumption is violated.
(Multiple Choice)
4.8/5 (34)
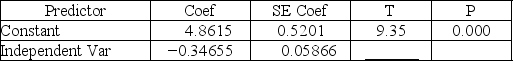
Consider the following partial computer output from a simple linear regression analysis.
 R2.9722
What is the estimated y-intercept?
R2.9722
What is the estimated y-intercept?
(Short Answer)
4.8/5 (36)
Use the following results obtained from a simple linear regression analysis with 12 observations.  = 37.2895 − (1.2024)X
r2 = .6744sb = .2934
Test to determine if there is a significant negative relationship between the independent and dependent variables at α = .05. Give the test statistic and the resulting conclusion.
= 37.2895 − (1.2024)X
r2 = .6744sb = .2934
Test to determine if there is a significant negative relationship between the independent and dependent variables at α = .05. Give the test statistic and the resulting conclusion.
(Short Answer)
4.8/5 (30)
The ________ assumption requires that all variation around the regression line should be equal at all possible values (levels) of the ________variable.
(Multiple Choice)
4.9/5 (27)
Regression Analysis.
 ANOVA
ANOVA
 Regression output
 A local grocery store wants to predict its daily sales in dollars. The manager believes that the amount of newspaper advertising significantly affects sales. He randomly selects 7 days of data consisting of daily grocery store sales (in thousands of dollars) and advertising expenditures (in thousands of dollars). The Excel/MegaStat output given above summarizes the results of the regression model.
Determine a 95 percent confidence interval estimate of the daily average store sales based on $3,000 advertising expenditures. The distance value for this particular prediction is reported as .164.
A local grocery store wants to predict its daily sales in dollars. The manager believes that the amount of newspaper advertising significantly affects sales. He randomly selects 7 days of data consisting of daily grocery store sales (in thousands of dollars) and advertising expenditures (in thousands of dollars). The Excel/MegaStat output given above summarizes the results of the regression model.
Determine a 95 percent confidence interval estimate of the daily average store sales based on $3,000 advertising expenditures. The distance value for this particular prediction is reported as .164.
(Short Answer)
4.9/5 (41)
Based on 30 time-ordered observations from a simple regression, we have determined the Durbin-Watson statistic, d = 2.71. At α = .05, test to determine if there is any evidence of negative autocorrelation. State your conclusions.
(Short Answer)
4.8/5 (36)
Consider the following partial computer output from a simple linear regression analysis.
 R2.9722
What is the predicted value of y when x = 1,000?
R2.9722
What is the predicted value of y when x = 1,000?
(Short Answer)
4.9/5 (38)
When the constant variance assumption holds, a plot of the residual versus x
(Multiple Choice)
4.7/5 (37)
Consider the following partial computer output from a simple linear regression analysis.
 S = .4862R-Sq = ________
Analysis of Variance
S = .4862R-Sq = ________
Analysis of Variance
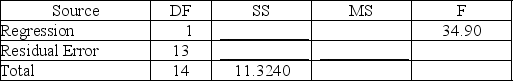 What is the correlation coefficient?
(Short Answer)
4.8/5 (32)
A simple regression analysis with 20 observations would yield ________ degrees of freedom error and ________degrees of freedom total.
(Multiple Choice)
4.9/5 (33)
The ________ the r2 and the ________ the s (standard error), the stronger the relationship between the dependent variable and the independent variable.
(Multiple Choice)
4.9/5 (43)
An experiment was performed on a certain metal to determine if the strength is a function of heating time. Results based on 10 metal sheets are given below. Use the simple linear regression model.
∑X = 30
∑X2 = 104
∑Y = 40
∑Y2 = 178
∑XY = 134
Calculate the correlation coefficient.
(Short Answer)
4.7/5 (40)
The dependent variable is the variable that is being described or predicted.
(True/False)
4.9/5 (44)
The least squares simple linear regression line minimizes the sum of the vertical deviations between the line and the data points.
(True/False)
4.8/5 (38)
A local tire dealer wants to predict the number of tires sold each month. He believes that the number of tires sold is a linear function of the amount of money invested in advertising. He randomly selects 6 months of data consisting of monthly tire sales (in thousands of tires) and monthly advertising expenditures (in thousands of dollars). The simple linear regression equation is ŷ = 3 + 1x, and the sample correlation coefficient (r2) = .6364. Test to determine if there is a significant correlation between the monthly tire sales and monthly advertising expenditures. Use H0: ρ = 0 vs. HA: ρ ≠ 0 at α = .05.
(Short Answer)
4.8/5 (31)
When using simple linear regression, we would like to use confidence intervals for the ________ and prediction intervals for the ________ at a given value of x.
(Multiple Choice)
4.8/5 (28)
Filters
- Essay(0)
- Multiple Choice(0)
- Short Answer(0)
- True False(0)
- Matching(0)