Exam 3: Graphical Descriptive Techniques II
Exam 1: What Is Statistics43 Questions
Exam 2: Graphical Descriptive Techniques I93 Questions
Exam 3: Graphical Descriptive Techniques II183 Questions
Exam 4: Numerical Descriptive Techniques274 Questions
Exam 5: Data Collection and Sampling82 Questions
Exam 6: Probability234 Questions
Exam 7: Random Variables and Discrete Probability Distributions274 Questions
Exam 8: Continuous Probability Distributions215 Questions
Exam 9: Sampling Distributions153 Questions
Exam 10: Introduction to Estimation152 Questions
Exam 11: Introduction to Hypothesis Testing182 Questions
Exam 12: Inference About a Population147 Questions
Exam 13: Inference About Comparing Two Populations170 Questions
Exam 14: Analysis of Variance153 Questions
Exam 15: Chi-Squared Tests175 Questions
Exam 16: Simple Linear Regression and Correlation298 Questions
Exam 17: Multiple Regression157 Questions
Select questions type
A line chart showing the number of crimes in Las Vegas from 2000 to 2005 may exhibit a totally different trend than a line chart showing the crime rate in Las Vegas from 2000 to 2005.(Crime rate is defined as number of crimes per 100,000 people.)
(True/False)
4.8/5  (23)
(23)
When two variables are linearly related, and tend to move in opposite directions, we describe the nature of their association as a negative linear relationship.
(True/False)
4.9/5 (38)
A line chart that is flat shows no fluctuation in the variable being presented.
(True/False)
4.9/5 (35)
A(n) ____________________ histogram is one with a long tail extending to either the right or the left.
(Short Answer)
4.8/5 (35)
A(n) ____________________ is created by plotting the value of the variable on the vertical axis and the time periods on the horizontal axis.
(Short Answer)
4.8/5 (37)
A line chart is created by plotting the values of the variable on the vertical axis and the time periods on the horizontal axis.
(True/False)
4.8/5 (24)
The sum of the relative frequencies for all classes in a histogram always equals
(Multiple Choice)
4.9/5 (35)
What are the two most important characteristics to look for in a scatter diagram?
(Essay)
4.9/5 (46)
Internet Classes
A survey of 25 students was conducted to determine how they rate the quality of Internet classes.Students were asked to rate the overall quality from 0 (no quality at all) to 100 (extremely good quality).The stem-and-leaf display of the data is shown below.
 -{Internet Classes Narrative} What percentage of the students rated the overall quality of on-line classes as being between 50 and 75, inclusive?
(Short Answer)
4.8/5 (34)
Thirty voters participating in a recent election exit poll in Alabama were asked to state their political party affiliation.Coding the data 1 for Republican, 2 for Democrat, and 3 for Independent, the data collected were as follows: 3, 1, 2, 3, 1, 3, 3, 2, 1, 3, 3, 2, 1, 1, 3, 2, 3, 1, 3, 2, 3, 2, 1, 1, 3, 1, 2, 2, 1, and 3.Develop a frequency distribution and a relative frequency distribution for this data.What does the data suggest about the strength of the political parties in Alabama?
(Essay)
4.8/5 (37)
The largest value of a cumulative relative frequency is ____________________.
(Short Answer)
4.9/5 (42)
Teachers Ages
The ages (in years) of a sample of 25 teachers are as follows:
 -{Teachers Ages Narrative} Draw a frequency histogram of this data which contains four classes.What is the shape of the histogram?
(Essay)
4.9/5 (33)
Which of the following describes the shape of the histogram below? 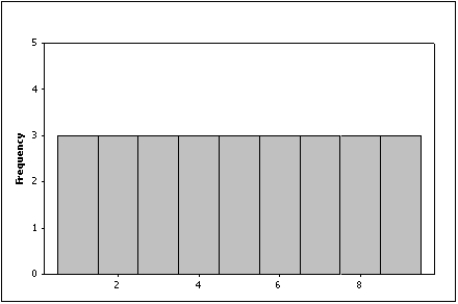
(Multiple Choice)
4.9/5 (40)
A histogram is said to be symmetric if, when we draw a vertical line down the center of the histogram the two sides are nearly identical.
(True/False)
4.8/5 (29)
A stem-and-leaf display reveals more information about the original data than does a histogram.
(True/False)
4.7/5 (32)
Filters
- Essay(0)
- Multiple Choice(0)
- Short Answer(0)
- True False(0)
- Matching(0)