Exam 3: Graphical Descriptive Techniques II
Exam 1: What Is Statistics43 Questions
Exam 2: Graphical Descriptive Techniques I93 Questions
Exam 3: Graphical Descriptive Techniques II183 Questions
Exam 4: Numerical Descriptive Techniques274 Questions
Exam 5: Data Collection and Sampling82 Questions
Exam 6: Probability234 Questions
Exam 7: Random Variables and Discrete Probability Distributions274 Questions
Exam 8: Continuous Probability Distributions215 Questions
Exam 9: Sampling Distributions153 Questions
Exam 10: Introduction to Estimation152 Questions
Exam 11: Introduction to Hypothesis Testing182 Questions
Exam 12: Inference About a Population147 Questions
Exam 13: Inference About Comparing Two Populations170 Questions
Exam 14: Analysis of Variance153 Questions
Exam 15: Chi-Squared Tests175 Questions
Exam 16: Simple Linear Regression and Correlation298 Questions
Exam 17: Multiple Regression157 Questions
Select questions type
The relationship between two interval variables is graphically displayed by a
(Multiple Choice)
4.8/5  (27)
(27)
Test scores
The scores on a calculus test for a random sample of 40 students are as follows:
 -{Test Grades Narrative} Construct a stem-and-leaf display for this data set.Describe the shape of the data.
(Essay)
4.9/5 (35)
A graph of the frequency distribution for interval data is called a(n) ____________________.
(Short Answer)
4.8/5 (41)
A(n) ____________________ is best defined as a set of symbols (such as people or animals) used to depict data.It often distorts the actual sizes of the items being portrayed.
(Short Answer)
4.7/5 (38)
The techniques of shrinking the horizontal axis or stretching the vertical axis have the effect of making the slope of the graph visually (but not numerically) steeper.
(True/False)
4.8/5 (35)
Fifty two truck buyers were asked to indicate the car dealer they believed offered the best overall service.The four choices were A, B, C, and D as shown below:
 Construct a table showing the frequencies and relative frequencies for this data set.What proportion of car buyers rated dealer D as the best?
(Essay)
4.9/5 (34)
Insurance Company
A representative from a local insurance agency selected a random sample of insured homeowners and recorded the number of claims made in the last three years, with the following results:
 -{Insurance Company Narrative} How many total claims are represented in the sample?
(Essay)
4.9/5 (39)
A relative frequency distribution describes the proportion of data values that fall within each category.
(True/False)
5.0/5 (43)
Insurance Company
A representative from a local insurance agency selected a random sample of insured homeowners and recorded the number of claims made in the last three years, with the following results:
-{Insurance Company Narrative} What number of claims was made by the highest proportion of homeowners?
(Essay)
4.8/5 (39)
A histogram is said to be ____________________ if, when we draw a vertical line down the center of the histogram, the two sides are identical in shape and size.
(Short Answer)
5.0/5 (36)
A modal class is the class with the largest number of observations.
(True/False)
4.8/5 (42)
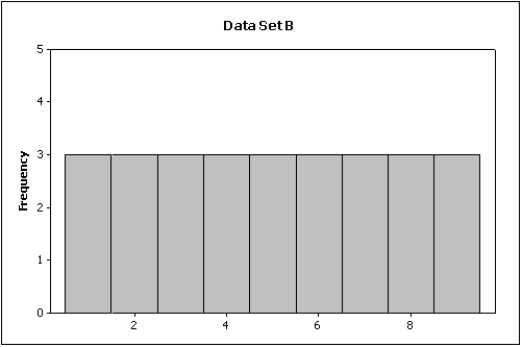
Compare the spread of the two histograms below.Which of the following is true? 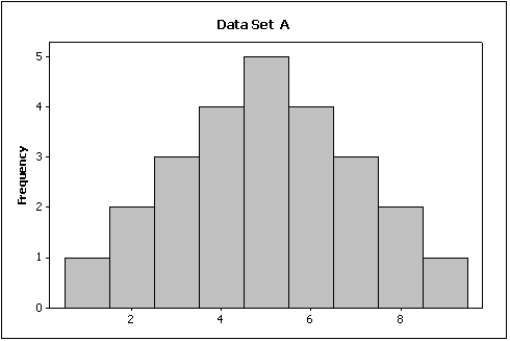
(Multiple Choice)
4.8/5 (43)
Which of the following is true about a stem-and-leaf display?
(Multiple Choice)
4.8/5 (31)
Insurance Company
A representative from a local insurance agency selected a random sample of insured homeowners and recorded the number of claims made in the last three years, with the following results:
-{Insurance Company Narrative} How many homeowners are represented in the sample?
(Short Answer)
4.7/5 (35)
Home Care
Data are collected on the number of house calls (x) made in a given week by each of 60 nurses in a certain hospital.The same data set is displayed in each of the three histograms below. 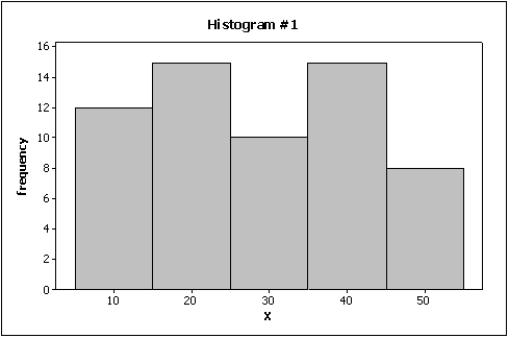
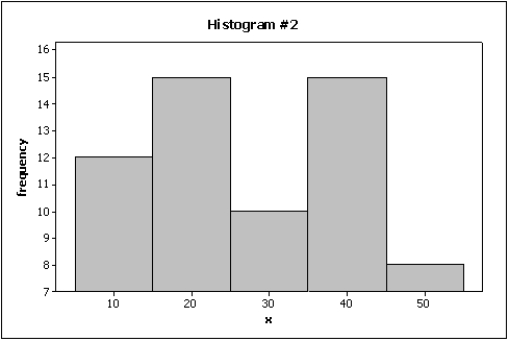
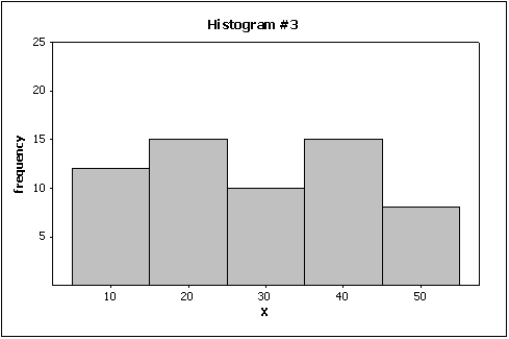 -{Home Care Narrative}Which graph do you think is the most appropriate display? Justify your answer.
(Essay)
4.8/5 (37)
Which of the following statements describe(s) the line chart below? 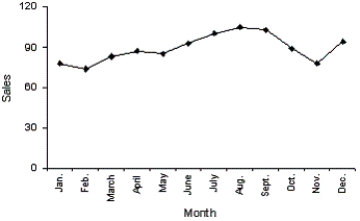
(Multiple Choice)
4.7/5 (37)
Observations that are taken during successive points in time are called ____________________ data.
(Short Answer)
4.9/5 (38)
Test scores
The scores on a calculus test for a random sample of 40 students are as follows:
-{Test Grades Narrative} Describe the distribution of exam scores.
(Essay)
4.7/5 (39)
The number of crimes per capita is known as the crime ____________________.It is a fairer way to represent and compare crimes from year to year or place to place.
(Short Answer)
4.8/5 (40)
Filters
- Essay(0)
- Multiple Choice(0)
- Short Answer(0)
- True False(0)
- Matching(0)