Exam 3: Graphical Descriptive Techniques II
Exam 1: What Is Statistics43 Questions
Exam 2: Graphical Descriptive Techniques I93 Questions
Exam 3: Graphical Descriptive Techniques II183 Questions
Exam 4: Numerical Descriptive Techniques274 Questions
Exam 5: Data Collection and Sampling82 Questions
Exam 6: Probability234 Questions
Exam 7: Random Variables and Discrete Probability Distributions274 Questions
Exam 8: Continuous Probability Distributions215 Questions
Exam 9: Sampling Distributions153 Questions
Exam 10: Introduction to Estimation152 Questions
Exam 11: Introduction to Hypothesis Testing182 Questions
Exam 12: Inference About a Population147 Questions
Exam 13: Inference About Comparing Two Populations170 Questions
Exam 14: Analysis of Variance153 Questions
Exam 15: Chi-Squared Tests175 Questions
Exam 16: Simple Linear Regression and Correlation298 Questions
Exam 17: Multiple Regression157 Questions
Select questions type
We create a frequency distribution for interval data by counting the number of observations that fall into each of a series of intervals, called ____________________.
(Short Answer)
4.8/5  (33)
(33)
A popular method of creating distorted impressions with bar charts is to construct the bars so that their widths are proportional to their heights.
(True/False)
4.7/5 (25)
In applications involving two variables, X and Y, where one variable depends to some degree on the other, we call X the ____________________ variable.
(Short Answer)
4.9/5 (41)
Differences in the frequencies of a histogram appear to be less dramatic if you ____________________ the vertical axis.
(Short Answer)
4.8/5 (34)
Insurance Company
A representative from a local insurance agency selected a random sample of insured homeowners and recorded the number of claims made in the last three years, with the following results:
 -{Insurance Company Narrative} What proportion of homeowners had no claims in the last three years?
(Short Answer)
4.9/5 (38)
The two most important characteristics to examine in a scatter diagram are the number of possible categories for X and Y and the number of observations in each category.
(True/False)
4.9/5 (32)
A(n) ____________________ histogram has two peaks, not necessarily equal in height.
(Short Answer)
4.9/5 (44)
The histogram below has a shape that is ____________________. 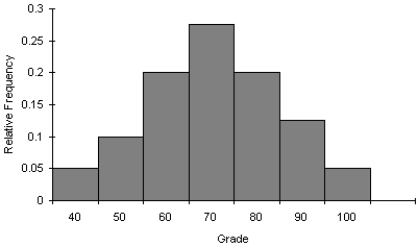
(Short Answer)
4.9/5 (38)
Briefly explain the difference between correlation and causation in terms of a relationship between X and Y.
(Essay)
4.7/5 (34)
A(n) ____________________ is a graphical representation of the cumulative relative frequencies.
(Short Answer)
4.8/5 (34)
Below are two line charts where the percentage return for a stock is shown over time.The two graphs are made from the same data set. 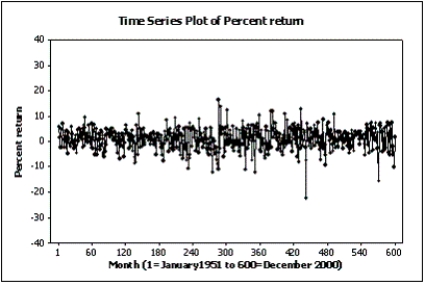
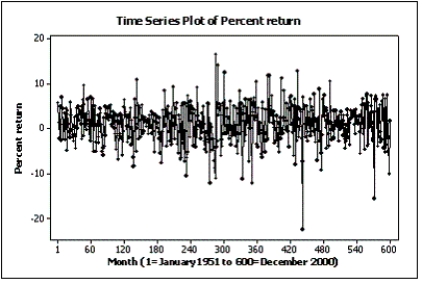 Explain why these two line charts look different.
(Essay)
4.9/5 (35)
Observations that are measured at successive points in time is what type of data?
(Multiple Choice)
4.7/5 (33)
The effect of making the slope of a line chart appear steeper can be created by:
(Multiple Choice)
4.9/5 (32)
It is speculated that the number of police officers has a negative linear relationship with number of crimes.Explain why this might be so.
(Essay)
4.8/5 (33)
The first scatter diagram below shows a stronger linear relationship than the second scatter diagram.(Assume the scales on both scatter diagrams are the same.) 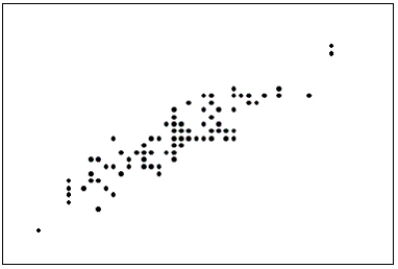
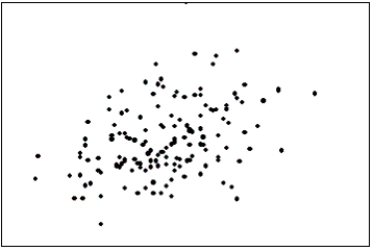
(True/False)
4.8/5 (35)
How do you determine whether two interval variables have a positive linear relationship?
(Multiple Choice)
4.8/5 (37)
Filters
- Essay(0)
- Multiple Choice(0)
- Short Answer(0)
- True False(0)
- Matching(0)