Exam 3: Graphical Descriptive Techniques II
Exam 1: What Is Statistics43 Questions
Exam 2: Graphical Descriptive Techniques I93 Questions
Exam 3: Graphical Descriptive Techniques II183 Questions
Exam 4: Numerical Descriptive Techniques274 Questions
Exam 5: Data Collection and Sampling82 Questions
Exam 6: Probability234 Questions
Exam 7: Random Variables and Discrete Probability Distributions274 Questions
Exam 8: Continuous Probability Distributions215 Questions
Exam 9: Sampling Distributions153 Questions
Exam 10: Introduction to Estimation152 Questions
Exam 11: Introduction to Hypothesis Testing182 Questions
Exam 12: Inference About a Population147 Questions
Exam 13: Inference About Comparing Two Populations170 Questions
Exam 14: Analysis of Variance153 Questions
Exam 15: Chi-Squared Tests175 Questions
Exam 16: Simple Linear Regression and Correlation298 Questions
Exam 17: Multiple Regression157 Questions
Select questions type
An online dating service has a quick poll on its website showing the following results.Critique the graph portion of the table.How can it be improved? 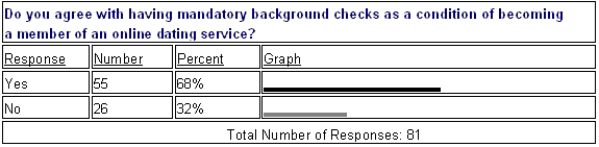
(Essay)
4.9/5  (33)
(33)
The number of houses sold in Miami Springs and the average monthly mortgage rates for 18 months randomly selected between January 2011 and April 2013 are shown in the following table.
 a.
Draw a scatter diagram with the number of houses sold on the vertical axis.
b.
Describe the relationship between mortgage rate and number of houses sold.
a.
Draw a scatter diagram with the number of houses sold on the vertical axis.
b.
Describe the relationship between mortgage rate and number of houses sold.
(Essay)
4.9/5 (44)
Test scores
The scores on a calculus test for a random sample of 40 students are as follows:
 -{Test Grades Narrative} Construct a cumulative frequency and a cumulative relative frequency distribution for this data.What proportion of the exam scores are less than 60? What proportion of the exam scores are 70 or more?
(Essay)
4.9/5 (33)
In a histogram, each observation is assigned to one or more classes.
(True/False)
4.9/5 (39)
Which of the following statements illustrates graphical deception?
(Multiple Choice)
4.7/5 (33)
Teachers Ages
The ages (in years) of a sample of 25 teachers are as follows:
 -{Teachers Ages Narrative} Construct an ogive for this data.Estimate the proportion of salespersons that are: 1) under 30 years of age; 2) 40 years of age or over; and 3) between 40 and 50 years of age.
(Essay)
4.9/5 (37)
When a distribution has more values to the right and tails to the left, we say it is skewed negatively.
(True/False)
4.9/5 (22)
In applications involving two variables, X and Y, where one variable depends to some degree on the other, we call Y the ____________________ variable.
(Short Answer)
4.9/5 (33)
A supermarket's monthly sales (in thousands of dollars) for the last year were as follows:
 Construct a relative frequency bar chart for this data set.How many observations are there in this data set?
(Essay)
4.9/5 (31)
If we draw a straight line through the points in a scatter diagram and most of the points fall close to the line, there must be a positive relationship between the two variables.
(True/False)
4.8/5 (29)
The scatter diagram below depicts data with a negative linear relationship. 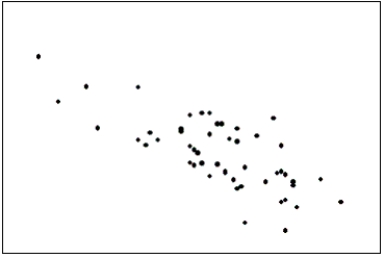
(True/False)
4.8/5 (32)
Test scores
The scores on a calculus test for a random sample of 40 students are as follows:
-{Test Grades Narrative) Construct an ogive for this data set.Use the ogive to estimate the proportion of exam scores that are between 80 and 90.
(Essay)
4.9/5 (39)
Which of the following statements about histograms is true?
(Multiple Choice)
4.7/5 (36)
Teachers Ages
The ages (in years) of a sample of 25 teachers are as follows:
-{Teachers Ages Narrative} Draw a frequency histogram of this data which contains six classes.What is the shape of the histogram?
(Essay)
4.8/5 (38)
An economics professor wants to study the relationship between income and education.A sample of 10 individuals is selected at random, and their income (in thousands of dollars) and education (in years) are shown below:
 a.
Draw a scatter diagram for these data with the income on the vertical axis.
b.
Describe the relationship between income and education.
a.
Draw a scatter diagram for these data with the income on the vertical axis.
b.
Describe the relationship between income and education.
(Essay)
4.8/5 (35)
The weights of a sample of 25 workers are given (in pounds): 164, 148, 137, 157, 173, 156, 177, 172, 169, 165, 145, 168, 163, 162, 174, 152, 156, 168, 154, 151, 174, 146, 134, 140, and 171.Construct an ogive for the data.What proportion of the worker's weights are between 160 and 180 pounds; below 150 pounds; and at or above 140 pounds, respectively?
(Essay)
4.8/5 (36)
A line chart is created by plotting the value of the variable on the ____________________ axis and the time periods on the ____________________ axis.
(Short Answer)
4.7/5 (27)
When two variables tend to move in opposite directions, yet still form a linear pattern, how do you describe their relationship?
(Multiple Choice)
4.9/5 (32)
Home Care
Data are collected on the number of house calls (x) made in a given week by each of 60 nurses in a certain hospital.The same data set is displayed in each of the three histograms below. 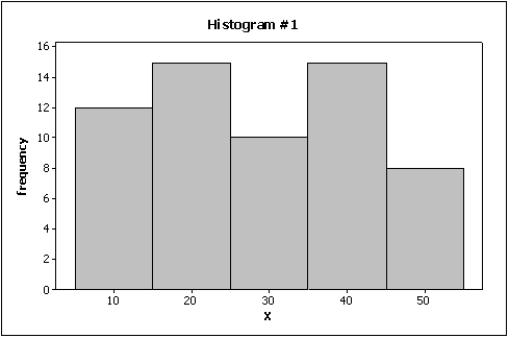
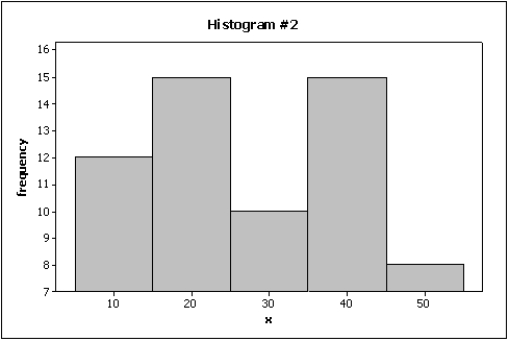
 -{Home Care Narrative} How many nurses are there in this hospital?
(Essay)
4.8/5 (38)
In order to draw a scatter diagram, we need interval data for
(Multiple Choice)
4.9/5 (32)
Filters
- Essay(0)
- Multiple Choice(0)
- Short Answer(0)
- True False(0)
- Matching(0)