Exam 8: Confidence Interval Estimation
Exam 1: Introduction to Business Analytics29 Questions
Exam 2: Describing the Distribution of a Single Variable100 Questions
Exam 3: Finding Relationships Among Variables85 Questions
Exam 4: Probability and Probability Distributions114 Questions
Exam 5: Normal, Binomial, Poisson, and Exponential Distributions125 Questions
Exam 6: Decision Making Under Uncertainty107 Questions
Exam 7: Sampling and Sampling Distributions90 Questions
Exam 8: Confidence Interval Estimation84 Questions
Exam 9: Hypothesis Testing87 Questions
Exam 10: Regression Analysis: Estimating Relationships92 Questions
Exam 11: Regression Analysis: Statistical Inference82 Questions
Exam 12: Time Series Analysis and Forecasting106 Questions
Exam 13: Introduction to Optimization Modeling97 Questions
Exam 14: Optimization Models114 Questions
Exam 15: Introduction to Simulation Modeling82 Questions
Exam 16: Simulation Models102 Questions
Exam 17: Data Mining20 Questions
Exam 18: Importing Data Into Excel19 Questions
Exam 19: Analysis of Variance and Experimental Design20 Questions
Exam 20: Statistical Process Control20 Questions
Select questions type
The t-distribution for developing a confidence interval for a mean has degrees of freedom equal to:
(Multiple Choice)
4.8/5  (37)
(37)
In order to construct a confidence interval estimate of the population mean  , the value of
  must be given.
(True/False)
4.8/5 (37)
(A) Construct a 90% confidence interval for the total value of all savings account balances within this bank. Assume that the population consists of all savings account balances in the frame.
(B) Interpret the 90% confidence interval constructed in (A).
(Essay)
4.8/5 (36)
When the samples we want to compare pair in some natural way, such as a pretest/posttest for each person or husband/wife pairs, a more appropriate form of analysis is to not compare two separate variables, but instead to compare their ____.
(Multiple Choice)
4.9/5 (35)
The interval estimate 18.5  2.5 is developed for a population mean in which the sample standard deviation s is 7.5. Had s equaled 15 instead, the interval estimate would be 37
  5.0.
5.0.
(True/False)
4.8/5 (44)
A company employs two shifts of workers. Each shift produces a type of gasket where the thickness is the critical dimension. The average thickness and the standard deviation of thickness for shift 1, based on a random sample of 40 gaskets, are 10.85 mm and 0.16 mm, respectively. The similar figures for shift 2, based on a random sample of 30 gaskets, are 10.90 mm and 0.19 mm. Let  be the difference in thickness between shifts 1 and 2, and assume that the population variances are equal.
-(A) Construct a 95% confidence interval for
be the difference in thickness between shifts 1 and 2, and assume that the population variances are equal.
-(A) Construct a 95% confidence interval for  .
(B) Based on your answer to (A), are you convinced that the gaskets from shift 2 are, on average, wider than those from shift 1? Why or why not?
.
(B) Based on your answer to (A), are you convinced that the gaskets from shift 2 are, on average, wider than those from shift 1? Why or why not?
(Essay)
4.9/5 (44)
If two samples contain the same number of observations, then the data must be paired.
(True/False)
4.8/5 (37)
If you decrease the confidence level, the confidence interval:
(Multiple Choice)
4.9/5 (38)
After calculating the sample size needed to estimate a population proportion to within 0.05, you have been told that the maximum allowable error (B) must be reduced to just 0.025. If the original calculation led to a sample size of 1000, the sample size will now have to be:
(Multiple Choice)
4.9/5 (43)
A 90% confidence interval estimate for a population mean  is determined to be 72.8 to 79.6. If the confidence level is reduced to 80%, the confidence interval for
  becomes narrower.
(True/False)
4.8/5 (35)
(A) Determine a 95% confidence interval for the proportion defective for the process today.
(B) Based on your answer to (A), is it still reasonable to think the overall proportion defective produced by today's process is actually the targeted 4%? Explain your reasoning.
(C) The confidence interval in (A) is based on the assumption of a large sample size. Is this sample size sufficiently large in this example? Explain how you arrived at your answer.
(D) How many units would have to be sampled to be 95% confident that you can estimate the fraction of defective parts within 2% (using the information from today's sample)?
(Essay)
4.9/5 (35)
(A) Compute 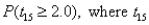 has a t-distribution with 15 degrees of freedom.
(B) Compute
has a t-distribution with 15 degrees of freedom.
(B) Compute 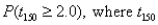 has a t-distribution with 150 degrees of freedom.
(C) How do you explain the difference between the results obtained in (A) and (B)?
(D) Compute
has a t-distribution with 150 degrees of freedom.
(C) How do you explain the difference between the results obtained in (A) and (B)?
(D) Compute  where Z is a standard normal random variable.
(E) Compare the results of (D) to the results obtained in (A) and (B). How do you explain the difference in these probabilities?
where Z is a standard normal random variable.
(E) Compare the results of (D) to the results obtained in (A) and (B). How do you explain the difference in these probabilities?
(Essay)
4.9/5 (38)
If a random sample of size 250 is taken from a population, where it is known that the population proportion p = 0.4, then the mean of the sampling distribution of the sample proportion  is 0.60.
(True/False)
4.9/5 (37)
The following values have been calculated using the T DIST and T INV functions in Excel®. These values come from a t- distribution with 15 degrees of freedom.
These values represent the probability to the right of the given positive values. 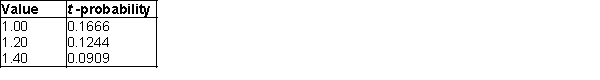 These values represent the positive t- value for a given probability in both tails (sum of both tails).
 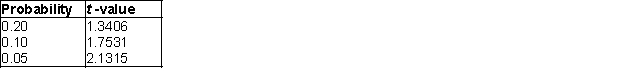 -What is the probability of a t-value smaller than 1.00?
(Short Answer)
4.7/5 (44)
From a sample of 500 items, 30 were found to be defective. The point estimate of the population proportion defective will be:
(Multiple Choice)
4.8/5 (30)
A market research consultant hired by Coke Classic Company is interested in estimating the difference between the proportions of female and male customers who favor Coke Classic over Pepsi Cola in Chicago. A random sample of 200 consumers from the market under investigation shows the following frequency distribution. 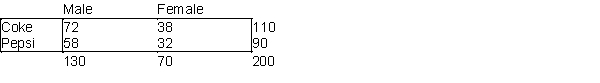
-(A) Construct a 95% confidence interval for the difference between the proportions of male and female customers who prefer Coke Classic® over Pepsi Cola®.
(B) Interpret the constructed confidence interval.
-(A) Construct a 95% confidence interval for the difference between the proportions of male and female customers who prefer Coke Classic® over Pepsi Cola®.
(B) Interpret the constructed confidence interval.
(Essay)
4.8/5 (35)
A real estate agent has collected a random sample of 40 houses that were recently sold in Grand Rapids, Michigan. She is interested in comparing the appraised value and recent selling price (in thousands of dollars) of the houses in this particular market. The values of these two variables for each of the 40 randomly selected houses are shown below. 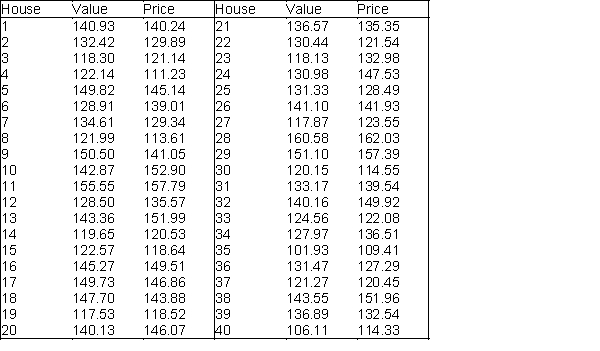 -(A) Use the sample data to generate a 95% confidence interval for the mean difference between the appraised values and selling prices of the houses sold in Grand Rapids.
(B) Interpret the constructed confidence interval fin (A) for the real estate agent.
-(A) Use the sample data to generate a 95% confidence interval for the mean difference between the appraised values and selling prices of the houses sold in Grand Rapids.
(B) Interpret the constructed confidence interval fin (A) for the real estate agent.
(Essay)
4.9/5 (35)
What is an example of a problem in which the sample data is likely to be paired?
(Multiple Choice)
4.8/5 (41)
The following values have been calculated using the T DIST and T INV functions in Excel®. These values come from a t- distribution with 15 degrees of freedom.
These values represent the probability to the right of the given positive values. These values represent the positive t- value for a given probability in both tails (sum of both tails).
-What would be the t-values where 0.95 of the values would fall within this interval?
(Short Answer)
4.9/5 (39)
When you calculate the sample size for a proportion, you use an estimate for the population proportion; namely  . A conservative value for n can be obtained by using
  = :
= :
(Multiple Choice)
4.7/5 (38)
Filters
- Essay(0)
- Multiple Choice(0)
- Short Answer(0)
- True False(0)
- Matching(0)