Exam 8: Confidence Interval Estimation
Exam 1: Introduction to Business Analytics29 Questions
Exam 2: Describing the Distribution of a Single Variable100 Questions
Exam 3: Finding Relationships Among Variables85 Questions
Exam 4: Probability and Probability Distributions114 Questions
Exam 5: Normal, Binomial, Poisson, and Exponential Distributions125 Questions
Exam 6: Decision Making Under Uncertainty107 Questions
Exam 7: Sampling and Sampling Distributions90 Questions
Exam 8: Confidence Interval Estimation84 Questions
Exam 9: Hypothesis Testing87 Questions
Exam 10: Regression Analysis: Estimating Relationships92 Questions
Exam 11: Regression Analysis: Statistical Inference82 Questions
Exam 12: Time Series Analysis and Forecasting106 Questions
Exam 13: Introduction to Optimization Modeling97 Questions
Exam 14: Optimization Models114 Questions
Exam 15: Introduction to Simulation Modeling82 Questions
Exam 16: Simulation Models102 Questions
Exam 17: Data Mining20 Questions
Exam 18: Importing Data Into Excel19 Questions
Exam 19: Analysis of Variance and Experimental Design20 Questions
Exam 20: Statistical Process Control20 Questions
Select questions type
The following values have been calculated using the T DIST and T INV functions in Excel®. These values come from a t- distribution with 15 degrees of freedom.
These values represent the probability to the right of the given positive values. 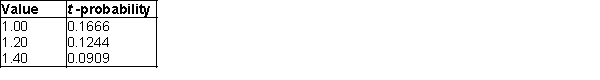 These values represent the positive t- value for a given probability in both tails (sum of both tails).
 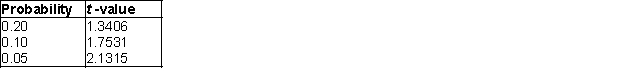 -What is the probability of a t-value larger than 1.20?
(Short Answer)
4.9/5  (33)
(33)
We can form a confidence interval for the population total T by finding a confidence interval for the population mean  in the usual way, and then multiplying the lower and upper limits the confidence interval by the population size N.
(True/False)
4.9/5 (36)
The approximate standard error of the point estimate of the population total is:
(Multiple Choice)
4.8/5 (37)
If you are constructing a confidence interval for a single mean, the confidence interval will _____ with an increase in the sample size.
(Multiple Choice)
4.8/5 (35)
In general, increasing the confidence level will narrow the confidence interval, and decreasing the confidence level widens the interval.
(True/False)
4.8/5 (36)
(A) Construct a 99% confidence interval for the proportion of company employees who prefer plan A. Assume that the population consists of the preferences of all employees in the frame.
(B) Interpret the 99% confidence interval constructed in (A).
(Essay)
4.8/5 (41)
When we replace  with the sample standard deviation (s), we introduce a new source of variability and the sampling distribution becomes the:
(Multiple Choice)
4.8/5 (37)
The standard error of the sampling distribution of the sample proportion  , when the sample size n = 50 and the population proportion p = 0.25, is 0.00375.
(True/False)
4.7/5 (45)
The lower limit of the 95% confidence interval for the population proportion p, given that n = 300; and  = 0.10 is 0.1339.
(True/False)
4.8/5 (37)
If you increase the confidence level, the confidence interval .
(Multiple Choice)
4.9/5 (39)
Generally speaking, the two types of statistical inference are:
(Multiple Choice)
4.8/5 (33)
Suppose there are 500 accounts in a population. You sample 50 of them and find a sample mean of $500. What would be your estimate for the population total?
(Multiple Choice)
4.9/5 (31)
If you are constructing a confidence interval for a single mean, the confidence interval will with a decrease in the sample size.
(Multiple Choice)
4.7/5 (29)
If two random samples of size 40 each are selected independently from two populations whose variances are 35 and 45, then the standard error of the sampling distribution of the sample mean difference,  , equals 1.4142.
(True/False)
4.8/5 (39)
The chi-square distribution for developing a confidence interval for a standard deviation has degrees of freedom equal to:
(Multiple Choice)
4.8/5 (34)
If a sample has 20 observations and a 95% confidence estimate for  is needed, the appropriate value of t-multiple is 2.093
(True/False)
4.9/5 (35)
Q-Mart is interested in comparing its male and female customers. Q-Mart would like to know if its female charge customers spend more money, on average, than its male charge customers. They have collected random samples of 25 female customers and 22 male customers. On average, women charge customers spend $102.23 and men charge customers spend $86.46. Some information are shown below. 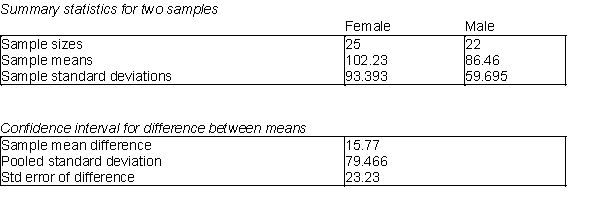 -(A) Use a t - value of 2.014 to calculate a 95% confidence interval for the difference between the average female purchase and the average male purchase. Would you conclude that there is a significant difference between females and males in this case? Explain.
(B) What are the degrees of freedom for the t-multiple in this calculation? Explain how you would calculate the degrees of freedom in this case.
(C) What is the assumption in this case that allows you to use the pooled standard deviation for this confidence interval?
-(A) Use a t - value of 2.014 to calculate a 95% confidence interval for the difference between the average female purchase and the average male purchase. Would you conclude that there is a significant difference between females and males in this case? Explain.
(B) What are the degrees of freedom for the t-multiple in this calculation? Explain how you would calculate the degrees of freedom in this case.
(C) What is the assumption in this case that allows you to use the pooled standard deviation for this confidence interval?
(Essay)
4.7/5 (32)
You are told that a random sample of 150 people from Iowa has been given cholesterol tests, and 60 of these people had levels over the "safe" count of 200. Construct a 95% confidence interval for the population proportion of people in Iowa with cholesterol levels over 200.
(Essay)
4.9/5 (31)
For a given confidence level, the procedure for controlling interval length usually begins with the specification of the:
(Multiple Choice)
4.9/5 (44)
You would like to estimate the average amount a family spends on food during a year. In the past, the standard deviation of the amount a family has spent on food during a year has been approximately $800. If you want to be 95% sure that you estimated average family food expenditures within $50, how many families do you need to survey?
(Essay)
5.0/5 (35)
Filters
- Essay(0)
- Multiple Choice(0)
- Short Answer(0)
- True False(0)
- Matching(0)