Exam 15: Introduction to Simulation Modeling
Exam 1: Introduction to Business Analytics29 Questions
Exam 2: Describing the Distribution of a Single Variable100 Questions
Exam 3: Finding Relationships Among Variables85 Questions
Exam 4: Probability and Probability Distributions114 Questions
Exam 5: Normal, Binomial, Poisson, and Exponential Distributions125 Questions
Exam 6: Decision Making Under Uncertainty107 Questions
Exam 7: Sampling and Sampling Distributions90 Questions
Exam 8: Confidence Interval Estimation84 Questions
Exam 9: Hypothesis Testing87 Questions
Exam 10: Regression Analysis: Estimating Relationships92 Questions
Exam 11: Regression Analysis: Statistical Inference82 Questions
Exam 12: Time Series Analysis and Forecasting106 Questions
Exam 13: Introduction to Optimization Modeling97 Questions
Exam 14: Optimization Models114 Questions
Exam 15: Introduction to Simulation Modeling82 Questions
Exam 16: Simulation Models102 Questions
Exam 17: Data Mining20 Questions
Exam 18: Importing Data Into Excel19 Questions
Exam 19: Analysis of Variance and Experimental Design20 Questions
Exam 20: Statistical Process Control20 Questions
Select questions type
We typically choose between a symmetric and skewed distribution on the basis of realism.
(True/False)
4.8/5  (26)
(26)
Which of the following statements is correct regarding the graph of a discrete probability distribution?
(Multiple Choice)
4.8/5 (29)
A common guideline in constructing confidence intervals for the mean is to place upper and lower bounds one standard error on either side of the average to obtain an approximate 95% confidence interval.
(True/False)
4.7/5 (36)
The uniform distribution is bounded by a minimum and a maximum, and all values between these two extremes are equally likely.
(True/False)
4.9/5 (43)
In August 2017, a car dealer is trying to determine how many 2018 cars to order. Each car ordered in August 2017 costs $16,000. The demand for the dealer's 2018 models has the probability distribution shown in the table below. Each car sells for $21,000. If the demand for 2018 cars exceeds the number of cars ordered in August 2017, the dealer must reorder at a cost of $18,000 per car. Excess cars can be disposed of at $13,000 per car.
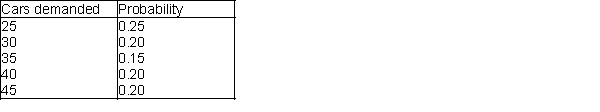 -(A) Use simulation to determine how many cars the dealer should order in August, 2017 to maximize his expected profit.
(B) For the optimal order quantity, find a 95% confidence interval for the expected profit.
(C) Why is it important to develop the confidence interval in (B)?
-(A) Use simulation to determine how many cars the dealer should order in August, 2017 to maximize his expected profit.
(B) For the optimal order quantity, find a 95% confidence interval for the expected profit.
(C) Why is it important to develop the confidence interval in (B)?
(Essay)
5.0/5 (34)
The binomial distribution can be well approximated by the normal distribution when the number of trials n is sufficiently small and the probability of success p is not too close to 0 or 1.
(True/False)
4.8/5 (36)
A probability distribution is bounded if there are values A and B such that:
(Multiple Choice)
4.9/5 (39)
Sometimes it is convenient to treat a discrete probability distribution as continuous, and vice versa.
(True/False)
4.8/5 (34)
RISKSIMTABLE is a function in @RISK for running several simulations simultaneously, one for each setting of an input or decision variable.
(True/False)
4.8/5 (43)
Obtain another set random numbers by pressing the F9 (recalculate) key. Do your results change significantly? Do the changes match your expectations? Explain your answer.
(Essay)
4.8/5 (23)
@RISK introduces uncertainty explicitly into a spreadsheet model by allowing several inputs to have probability distributions and then enabling the simulation of random values from these inputs.
(True/False)
4.8/5 (34)
The "building blocks" of all spreadsheet simulation models are:
(Multiple Choice)
4.8/5 (28)
Oregon State University has reached the final four in the 2016 NCAA Women's Basketball Tournament, and as a result, a sweatshirt supplier in Corvallis is trying to decide how many sweatshirts to print for the upcoming championships. The final four teams (Oregon State, University of Washington, Syracuse, and University of Connecticut) have emerged from the quarterfinal round, and there is a week left until the semifinals, which are then followed in a couple of days by the finals. Each sweatshirt costs $12 to produce and sells for $24. However, in three weeks, any leftover sweatshirts will be put on sale for half price, $12. The supplier assumes that the demand (in thousands) for his sweatshirts during the next three weeks, when interest is at its highest, follows the probability distribution shown in the table below. The residual demand, after the sweatshirts have been put on sale, also has the probability distribution shown in the table below. The supplier realizes that every sweatshirt sold, even at the sale price, yields a profit. However, he also realizes that any sweatshirts produced but not sold must be thrown away, resulting in a $12 loss per sweatshirt.
Demand distribution at regular price Demand distribution at reduced price
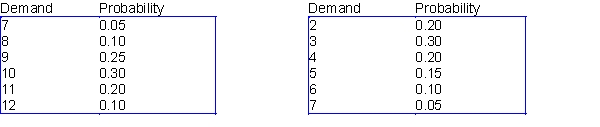 -Use simulation to analyze the supplier's problem. Determine how many sweatshirts he should produce to maximize the expected profit.
(Essay)
4.8/5 (35)
(A) What fraction of the random numbers are smaller than 0.5?
(B) What fraction of the time is a random number less than 0.5 followed by another random number less than 0.5?
(C) What fraction of the random numbers are larger than 0.8?
(D) What do you expect the answers to (A), (B) and (C) to be before simulating? Do the answers you provided to those questions match your expectations? Explain why or why not.
(E) Suppose your answers to (A), (B) and (C) are not close to the expected answers. What can you do to obtain answers from the simulation that are closer to the expected answers?
(Essay)
4.8/5 (25)
Discrete distributions are sometimes used as approximations of continuous distributions:
(Multiple Choice)
4.8/5 (42)
Which of the following statements are false regarding the numbers generated by the RAND function in Excel®?
(Multiple Choice)
4.9/5 (36)
If we want to model the monthly return on a stock, a good option would be:
(Multiple Choice)
4.8/5 (39)
In order to generate random numbers in Excel® from a discrete distribution with a finite number of possible values and corresponding probabilities, we can use:
(Multiple Choice)
4.9/5 (32)
Which of the following statements is/are true regarding a simulation model?
(Multiple Choice)
4.8/5 (39)
The triangular distribution is sometimes used in simulation models because it is more flexible and intuitive than the normal distribution.
(True/False)
4.8/5 (36)
Filters
- Essay(0)
- Multiple Choice(0)
- Short Answer(0)
- True False(0)
- Matching(0)