Exam 15: Introduction to Simulation Modeling
Exam 1: Introduction to Business Analytics29 Questions
Exam 2: Describing the Distribution of a Single Variable100 Questions
Exam 3: Finding Relationships Among Variables85 Questions
Exam 4: Probability and Probability Distributions114 Questions
Exam 5: Normal, Binomial, Poisson, and Exponential Distributions125 Questions
Exam 6: Decision Making Under Uncertainty107 Questions
Exam 7: Sampling and Sampling Distributions90 Questions
Exam 8: Confidence Interval Estimation84 Questions
Exam 9: Hypothesis Testing87 Questions
Exam 10: Regression Analysis: Estimating Relationships92 Questions
Exam 11: Regression Analysis: Statistical Inference82 Questions
Exam 12: Time Series Analysis and Forecasting106 Questions
Exam 13: Introduction to Optimization Modeling97 Questions
Exam 14: Optimization Models114 Questions
Exam 15: Introduction to Simulation Modeling82 Questions
Exam 16: Simulation Models102 Questions
Exam 17: Data Mining20 Questions
Exam 18: Importing Data Into Excel19 Questions
Exam 19: Analysis of Variance and Experimental Design20 Questions
Exam 20: Statistical Process Control20 Questions
Select questions type
(A) Generate the "birthdays" of 30 different people, assuming that each person has a 1/365 chance of having a given birthday (call the days of the year 1, 2, 3, ……..,365). You can use a formula involving the DISCRETE and RAND functions to generate birthdays.
(B) Once you have generated 30 people's birthdays, you can tell whether at least two people have the same birthday using Excel's RANK function (i.e., in the case of a tie, two numbers are given the same rank). Do you see any people with the same birthday in your sample?
(C) Obtain at least 20 samples of the 30-person group using the F9 key. What do you estimate the probability of finding two people with the same birthday in a sample of 30 people to be?
(Essay)
4.9/5  (37)
(37)
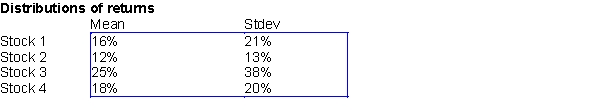
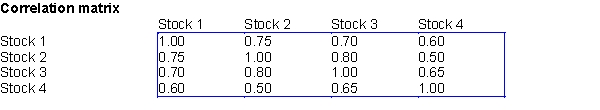
Suppose that Ms. Smart invests 25% of her portfolio in four different stocks. The mean and standard deviation of the annual return on each stock are shown in the first table below. The correlations between the annual returns on the four stocks are shown in the second table below.
 -(A) Use @RISK with 100 replications, provide a summary statistics of portfolio return; namely, minimum, maximum, mean, and standard deviation.
(B) Use your answers to (A) to estimate the probability that Mrs. Smart's portfolio's annual return will exceed 20%.
(C) Use your answers to (A) to estimate the probability that Mrs. Smart's portfolio will lose money during the course of a year.
(D) Suppose that the current price of each stock is as follows: stock 1: $16; stock 2: $18; stock 3: $20; and stock 4: $22. Ms. Smart has just bought an option involving these four stocks. If the price of stock 1, six months from now are is $18 or more, the option enables Ms. Smart to buy, if she desires, one share of each stock for $20 six months from now. Otherwise the option is worthless. For example, if the stock prices six months from now are: stock 1: $18; stock 2: $20; stock 3: $21; and stock 4: $24, then Ms. Smart would exercise her option to buy stocks 3 and 4 and receive (21- 20) + (24-20) = $5 in each cash flow. How much is this option worth if the risk-free rate is 8%?
-(A) Use @RISK with 100 replications, provide a summary statistics of portfolio return; namely, minimum, maximum, mean, and standard deviation.
(B) Use your answers to (A) to estimate the probability that Mrs. Smart's portfolio's annual return will exceed 20%.
(C) Use your answers to (A) to estimate the probability that Mrs. Smart's portfolio will lose money during the course of a year.
(D) Suppose that the current price of each stock is as follows: stock 1: $16; stock 2: $18; stock 3: $20; and stock 4: $22. Ms. Smart has just bought an option involving these four stocks. If the price of stock 1, six months from now are is $18 or more, the option enables Ms. Smart to buy, if she desires, one share of each stock for $20 six months from now. Otherwise the option is worthless. For example, if the stock prices six months from now are: stock 1: $18; stock 2: $20; stock 3: $21; and stock 4: $24, then Ms. Smart would exercise her option to buy stocks 3 and 4 and receive (21- 20) + (24-20) = $5 in each cash flow. How much is this option worth if the risk-free rate is 8%?
(Essay)
4.9/5 (28)
Filters
- Essay(0)
- Multiple Choice(0)
- Short Answer(0)
- True False(0)
- Matching(0)