Exam 11: Regression Analysis: Statistical Inference
Exam 1: Introduction to Business Analytics29 Questions
Exam 2: Describing the Distribution of a Single Variable100 Questions
Exam 3: Finding Relationships Among Variables85 Questions
Exam 4: Probability and Probability Distributions114 Questions
Exam 5: Normal, Binomial, Poisson, and Exponential Distributions125 Questions
Exam 6: Decision Making Under Uncertainty107 Questions
Exam 7: Sampling and Sampling Distributions90 Questions
Exam 8: Confidence Interval Estimation84 Questions
Exam 9: Hypothesis Testing87 Questions
Exam 10: Regression Analysis: Estimating Relationships92 Questions
Exam 11: Regression Analysis: Statistical Inference82 Questions
Exam 12: Time Series Analysis and Forecasting106 Questions
Exam 13: Introduction to Optimization Modeling97 Questions
Exam 14: Optimization Models114 Questions
Exam 15: Introduction to Simulation Modeling82 Questions
Exam 16: Simulation Models102 Questions
Exam 17: Data Mining20 Questions
Exam 18: Importing Data Into Excel19 Questions
Exam 19: Analysis of Variance and Experimental Design20 Questions
Exam 20: Statistical Process Control20 Questions
Select questions type
Which of the following is not one of the assumptions of regression?
(Multiple Choice)
4.8/5  (42)
(42)
A multiple regression model involves 40 observations and 4 explanatory variables produces SST = 1000 and SSR = 804. The value of MSE is 5.6.
(True/False)
4.8/5 (33)
The value k in the number of degrees of freedom, n-k-1, for the sampling distribution of the regression coefficients represents the:
(Multiple Choice)
4.8/5 (29)
If you can determine that the outlier is not really a member of the relevant population, then it is appropriate and probably best to:
(Multiple Choice)
4.7/5 (31)
A scatterplot that exhibits a "fan" shape (the variation of Y increases as X increases) is an example of:
(Multiple Choice)
4.7/5 (34)
Residuals separated by one period that are autocorrelated indicate:
(Multiple Choice)
4.8/5 (35)
The manager of a commuter rail transportation system is asked by his governing board to predict the demand for rides in the large city served by the transportation network. The system manager has collected data on variables thought to be related to the number of weekly riders on the city's rail system. The table shown below contains these data. 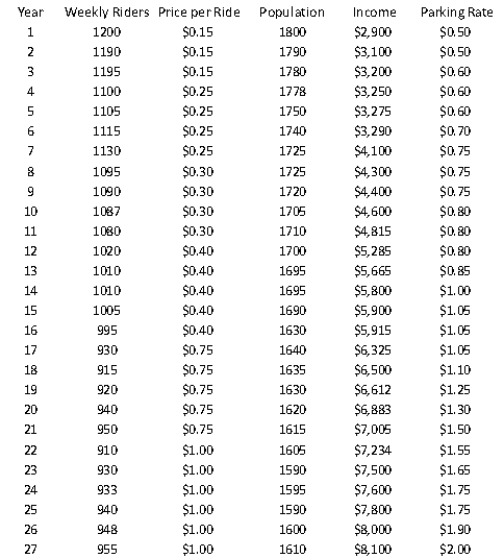 The variables "weekly riders" and "population" are measured in thousands, and the variables "price per ride", "income", and "parking rate" are measured in dollars.
-(A) Estimate a multiple regression model using all of the available explanatory variables.
(B) Conduct and interpret the result of an F- test on the given model. Employ a 5% level of significance in conducting this statistical hypothesis test.
(C) Is there evidence of autocorrelated residuals in this model? Explain why or why not.
The variables "weekly riders" and "population" are measured in thousands, and the variables "price per ride", "income", and "parking rate" are measured in dollars.
-(A) Estimate a multiple regression model using all of the available explanatory variables.
(B) Conduct and interpret the result of an F- test on the given model. Employ a 5% level of significance in conducting this statistical hypothesis test.
(C) Is there evidence of autocorrelated residuals in this model? Explain why or why not.
(Essay)
4.8/5 (38)
A point that "tilts" the regression line toward it, is referred to as a(n):
(Multiple Choice)
4.9/5 (30)
In a simple linear regression problem, if the standard error of estimate  = 15 and n = 8, then the sum of squares for error, SSE, is 1,350.
(True/False)
4.7/5 (39)
A manufacturing firm wants to determine whether a relationship exists between the number of work-hours an employee misses per year (Y) and the employee's annual wages (X), to test the hypothesis that increased compensation induces better work attendance. The data provided in the table below are based on a random sample of 15 employees from this organization. 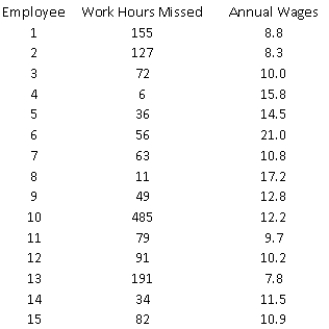 -(A) Estimate a simple linear regression model using the sample data. How well does the estimated model fit the sample data?
(B) Perform an F-test for the existence of a linear relationship between Y and X. Use a 5% level of significance.
(C) Plot the fitted values versus residuals associated with the model. What does the plot indicate?
(D) How do you explain the results you have found in (A) through (C)?
(E) Suppose you learn that the 10th employee in the sample has been fired for missing an excessive number of work-hours during the past year. In light of this information, how would you proceed to estimate the relationship between the number of work-hours an employee misses per year and the employee's annual wages, using the available information? If you decide to revise your estimate of this regression equation, repeat (A) and (B)
-(A) Estimate a simple linear regression model using the sample data. How well does the estimated model fit the sample data?
(B) Perform an F-test for the existence of a linear relationship between Y and X. Use a 5% level of significance.
(C) Plot the fitted values versus residuals associated with the model. What does the plot indicate?
(D) How do you explain the results you have found in (A) through (C)?
(E) Suppose you learn that the 10th employee in the sample has been fired for missing an excessive number of work-hours during the past year. In light of this information, how would you proceed to estimate the relationship between the number of work-hours an employee misses per year and the employee's annual wages, using the available information? If you decide to revise your estimate of this regression equation, repeat (A) and (B)
(Essay)
4.9/5 (33)
Heteroscedasticity means that the variability of Y values is larger for some X values than for others.
(True/False)
4.8/5 (35)
Time series data often exhibits which of the following characteristics?
(Multiple Choice)
4.7/5 (42)
A company that makes baseball caps would like to predict the sales of its main product, standard little league caps. The company has gathered data on monthly sales of caps at all of its retail stores, along with information related to the average retail price, which varies by location. Below you will find regression output comparing these two variables. 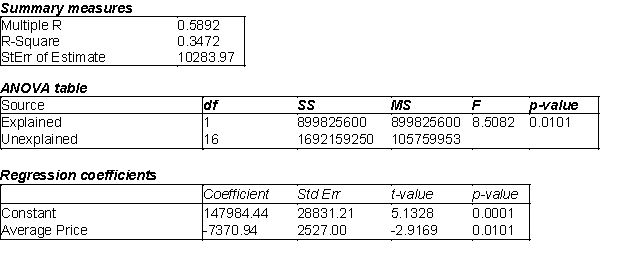 -(A) Estimate the regression model. How well does this model fit the given data?
(B) Is there a linear relationship between X and Y at the 5% significance level? Explain how you arrived at your answer.
(C) Use the estimated regression model to predict the number of caps that will be sold during the next month if the average selling price is $10.
(D) Find a 95% prediction interval for the number of caps determined in (C). Use t- multiple = 2.
(E) Find a 95% confidence interval for the average number of caps sold given an average selling price of $10. Use a t-multiple = 2.
(F) How do you explain the differences between the widths of the intervals in (D) and (E)?
-(A) Estimate the regression model. How well does this model fit the given data?
(B) Is there a linear relationship between X and Y at the 5% significance level? Explain how you arrived at your answer.
(C) Use the estimated regression model to predict the number of caps that will be sold during the next month if the average selling price is $10.
(D) Find a 95% prediction interval for the number of caps determined in (C). Use t- multiple = 2.
(E) Find a 95% confidence interval for the average number of caps sold given an average selling price of $10. Use a t-multiple = 2.
(F) How do you explain the differences between the widths of the intervals in (D) and (E)?
(Essay)
4.8/5 (34)
In multiple regression with k explanatory variables, the t-tests of the individual coefficients allows us to determine whether  (for i = 1, 2, …., k), which tells us whether a linear relationship exists between
  and Y.
(True/False)
4.9/5 (34)
In order to estimate with 90% confidence a particular value of Y for a given value of X in a simple linear regression problem, a random sample of 20 observations is taken. The appropriate t-value that would be used is 1.734.
(True/False)
4.8/5 (34)
Filters
- Essay(0)
- Multiple Choice(0)
- Short Answer(0)
- True False(0)
- Matching(0)