Exam 19: Statistical Methods for Quality Control
Exam 1: Data and Statistics98 Questions
Exam 2: Descriptive Statistics: Tabular and Graphical Displays62 Questions
Exam 3: Descriptive Statistics: Numerical Measures173 Questions
Exam 4: Introduction to Probability138 Questions
Exam 5: Discrete Probability Distributions123 Questions
Exam 6: Continuous Probability Distributions174 Questions
Exam 7: Sampling and Sampling Distributions133 Questions
Exam 8: Interval Estimation137 Questions
Exam 9: Hypothesis Tests148 Questions
Exam 10: Inference About Means and Proportions With Two Populations121 Questions
Exam 11: Inferences About Population Variances90 Questions
Exam 12: Comparing Multiple Proportions, Test of Independence and Goodness of Fit90 Questions
Exam 13: Experimental Design and Analysis of Variance115 Questions
Exam 14: Simple Linear Regression146 Questions
Exam 15: Multiple Regression115 Questions
Exam 16: Regression Analysis: Model Building76 Questions
Exam 17: Time Series Analysis and Forecasting68 Questions
Exam 18: Nonparametric Methods81 Questions
Exam 19: Statistical Methods for Quality Control29 Questions
Exam 20: Index Numbers52 Questions
Exam 21: Decision Analysis on Website65 Questions
Exam 22: Sample Survey on Website63 Questions
Select questions type
A production process is considered in control if no more than to 6% of the items produced are defective. Samples of size 300 are used for the inspection process.
a.Determine the standard error of the proportion.
b.Determine the upper and the lower control limits for the P chart.
(Short Answer)
4.8/5  (36)
(36)
A production process is considered in control if it processes at least 98.5% non-defective items. Samples of size 400 are used for the inspection process. Determine the upper and lower control limits for the P chart of defective elements.
(Essay)
4.9/5 (40)
The results of inspection of samples of a product taken over the past 10 days are given below. Sample size for each day has been 140. 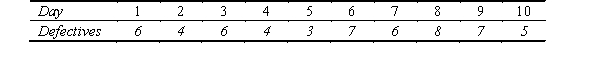 Determine the 97% upper and lower control limits for the p-chart.
(Short Answer)
4.8/5 (37)
A production process that is in control has a mean (µ) of 200 and a standard deviation ( ) of 22.
Determine the lower and the upper control limits for sample sizes of 49.
(Short Answer)
4.7/5 (40)
The quality control department of a company has decided to select a sample of 20 items from each shipment of goods it receives and inspect them for defects. It has been decided that if the sample contains no defective parts, the entire lot will be accepted.
a.What is the probability of accepting a lot that contains 10% defective items?
b.What is the probability of accepting a lot that contains 5% defective items?
c.What is the probability of rejecting a lot that contains 15% defective items?
(Short Answer)
4.8/5 (41)
Variations in process output that are due to factors such as machine tools wearing out are
(Multiple Choice)
4.9/5 (30)
Chocolate, Inc. manufactures 4 ounce chocolate bars. Random samples of size four were taken and weighed. Eight hours of observation provided the following data. 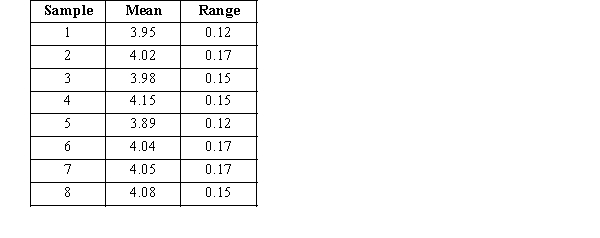 a.Determine the 3 sigma upper and lower control limits for the x-bar chart.
b.Determine the 3 sigma upper and lower control limits for the R-chart.
a.Determine the 3 sigma upper and lower control limits for the x-bar chart.
b.Determine the 3 sigma upper and lower control limits for the R-chart.
(Essay)
4.9/5 (37)
A production process is set up to fill containers with 16 ounces of liquid. The standard deviation is known to be 0.5 ounces. The quality control department periodically selects samples of 25 containers and measures the contents. (Assume the distribution of filling volumes is normal.)
a.Determine the upper and lower control limits.
b.Explain the meaning of the values you found in part
(Essay)
4.9/5 (34)
Filters
- Essay(0)
- Multiple Choice(0)
- Short Answer(0)
- True False(0)
- Matching(0)