Exam 13: Experimental Design and Analysis of Variance
Exam 1: Data and Statistics98 Questions
Exam 2: Descriptive Statistics: Tabular and Graphical Displays62 Questions
Exam 3: Descriptive Statistics: Numerical Measures173 Questions
Exam 4: Introduction to Probability138 Questions
Exam 5: Discrete Probability Distributions123 Questions
Exam 6: Continuous Probability Distributions174 Questions
Exam 7: Sampling and Sampling Distributions133 Questions
Exam 8: Interval Estimation137 Questions
Exam 9: Hypothesis Tests148 Questions
Exam 10: Inference About Means and Proportions With Two Populations121 Questions
Exam 11: Inferences About Population Variances90 Questions
Exam 12: Comparing Multiple Proportions, Test of Independence and Goodness of Fit90 Questions
Exam 13: Experimental Design and Analysis of Variance115 Questions
Exam 14: Simple Linear Regression146 Questions
Exam 15: Multiple Regression115 Questions
Exam 16: Regression Analysis: Model Building76 Questions
Exam 17: Time Series Analysis and Forecasting68 Questions
Exam 18: Nonparametric Methods81 Questions
Exam 19: Statistical Methods for Quality Control29 Questions
Exam 20: Index Numbers52 Questions
Exam 21: Decision Analysis on Website65 Questions
Exam 22: Sample Survey on Website63 Questions
Select questions type
Samples were selected from three populations. The data obtained are shown below. 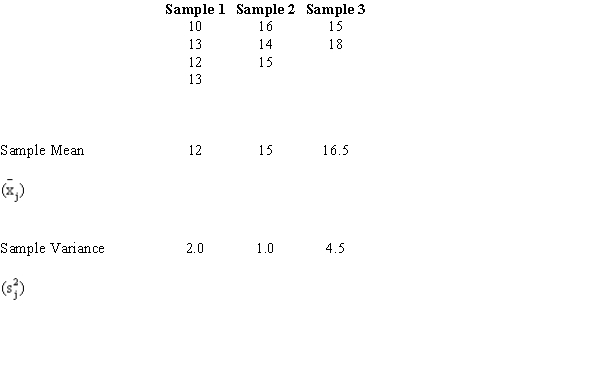 a.Compute the overall mean
  .
b.Set up an ANOVA table for this problem.
c.At 95% confidence, test to determine whether there is a significant difference in the means of the three populations. Use both the critical and p-value approaches.
.
b.Set up an ANOVA table for this problem.
c.At 95% confidence, test to determine whether there is a significant difference in the means of the three populations. Use both the critical and p-value approaches.
(Essay)
4.8/5  (32)
(32)
Exhibit 13-1 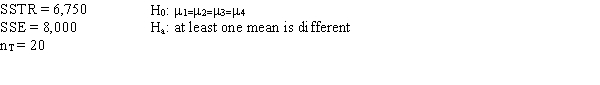 -Refer to Exhibit 13-1. The mean square within treatments (MSE) equals
(Multiple Choice)
4.9/5 (36)
Exhibit 13-2 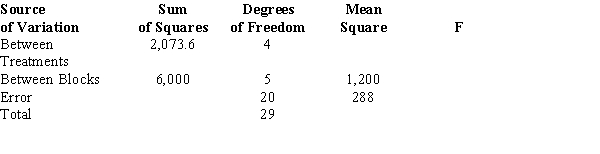 -Refer to Exhibit 13-2. The null hypothesis for this ANOVA problem is
(Multiple Choice)
4.9/5 (39)
A dietician wants to see if there is any difference in the effectiveness of three diets. Eighteen people were randomly chosen for the test. Then each individual was randomly assigned to one of the three diets. Below you are given the total amount of weight lost in six months by each person. 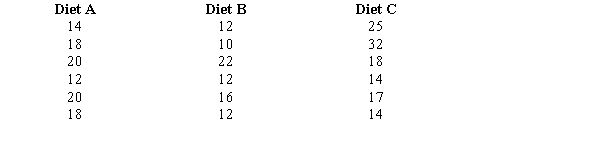 a.State the null and alternative hypotheses.
b.Calculate the test statistic.
c.What would you advise the dietician about the effectiveness of the three diets? Use a .05 level of significance.
a.State the null and alternative hypotheses.
b.Calculate the test statistic.
c.What would you advise the dietician about the effectiveness of the three diets? Use a .05 level of significance.
(Essay)
4.9/5 (36)
In a completely randomized experimental design, 11 experimental units were used for each of the 4 treatments. Part of the ANOVA table is shown below. 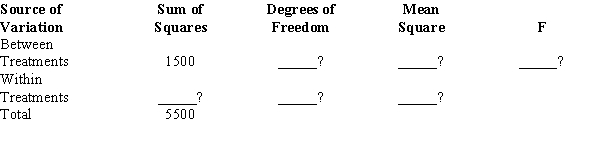 Fill in the blanks in the above ANOVA table.
(Essay)
4.9/5 (37)
Carolina, Inc. has three stores located in three different areas. Random samples of the sales of the three stores (in $1,000) are shown below. Please note that the sample sizes are not equal. 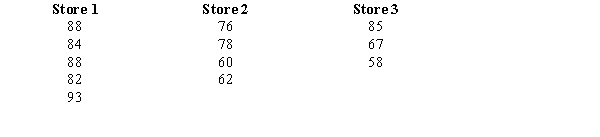 a.Compute the overall mean
  .
b.At 95% confidence, test to see if there is a significant difference in the average sales of the three stores. Use both the critical value and p-value approaches. Show your complete work and the ANOVA table.
.
b.At 95% confidence, test to see if there is a significant difference in the average sales of the three stores. Use both the critical value and p-value approaches. Show your complete work and the ANOVA table.
(Essay)
4.8/5 (35)
Exhibit 13-2
-Refer to Exhibit 13-2. The mean square between treatments equals
(Multiple Choice)
4.7/5 (29)
Three universities in your state decided to administer the same comprehensive examination to the recipients of MBA degrees from the three institutions. From each institution, MBA recipients were randomly selected and were given the test. The following table shows the scores of the students from each university. 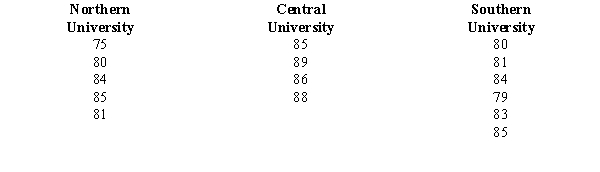 At = 0.01, test to see if there is any significant difference in the average scores of the students from the three universities. (Note that the sample sizes are not equal.) Use both the critical and p-value approaches.
(Essay)
4.8/5 (38)
Nancy, Inc. has three stores located in three different areas. Random samples of the sales of the three stores (In $1,000) are shown below. 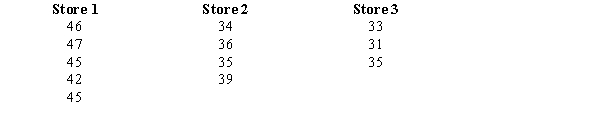 a.Compute the overall mean
  .
b.At 95% confidence, test to see if there is a significant difference in the average sales of the three stores.
.
b.At 95% confidence, test to see if there is a significant difference in the average sales of the three stores.
(Essay)
4.8/5 (26)
Exhibit 13-7
The following is part of an ANOVA table that was obtained from data regarding three treatments and a total of 15 observations. 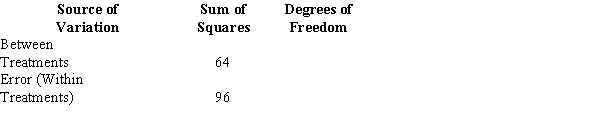 -Refer to Exhibit 13-7. The computed test statistics is
(Multiple Choice)
4.8/5 (36)
In a completely randomized experimental design, 7 experimental units were used for the first treatment, 9 experimental units for the second treatment, and 14 experimental units for the third treatment. Part of the ANOVA table for this experiment is shown below. 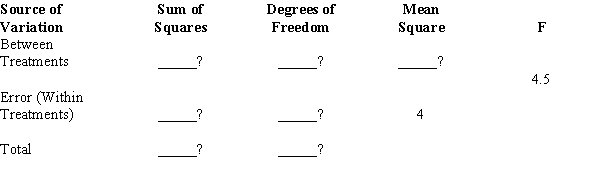 a.Fill in all the blanks in the above ANOVA table.
b.At 95% confidence using both the critical value and p-value approaches, test to see if there is a significant difference among the means.
a.Fill in all the blanks in the above ANOVA table.
b.At 95% confidence using both the critical value and p-value approaches, test to see if there is a significant difference among the means.
(Essay)
4.8/5 (33)
MNM, Inc. has three stores located in three different areas. Random samples of the daily sales of the three stores (in $1,000) are shown below. 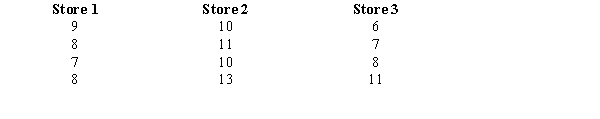 At 95% confidence, test to see if there is a significant difference in the average sales of the three stores. Use both the critical and p-value approaches.
(Essay)
4.8/5 (31)
Exhibit 13-4
In a completely randomized experimental design involving five treatments, 13 observations were recorded for each of the five treatments (a total of 65 observations). The following information is provided.
SSTR = 200 (Sum Square Between Treatments)
SST = 800 (Total Sum Square)
-Refer to Exhibit 13-4. The mean square between treatments (MSTR) is
(Multiple Choice)
4.9/5 (48)
Exhibit 13-1
-Refer to Exhibit 13-1. The test statistic to test the null hypothesis equals
(Multiple Choice)
4.8/5 (38)
In a completely randomized experimental design, 14 experimental units were used for each of the 5 levels of the factor (i.e., 5 treatments). Fill in the blanks in the following ANOVA table. 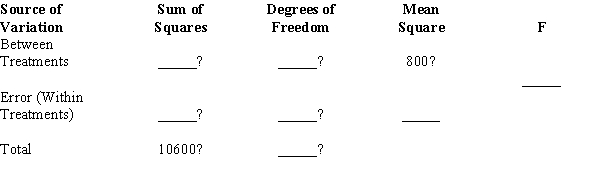
(Essay)
4.8/5 (37)
Exhibit 13-3
To test whether or not there is a difference between treatments A, B, and C, a sample of 12 observations has been randomly assigned to the 3 treatments. You are given the results below. 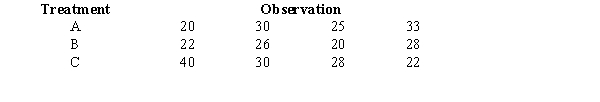 -Refer to Exhibit 13-3. The mean square between treatments (MSTR) equals
(Multiple Choice)
4.9/5 (30)
Exhibit 13-3
To test whether or not there is a difference between treatments A, B, and C, a sample of 12 observations has been randomly assigned to the 3 treatments. You are given the results below.
-Refer to Exhibit 13-3. The mean square within treatments (MSE) equals
(Multiple Choice)
4.9/5 (32)
The number of times each experimental condition is observed in a factorial design is known as
(Multiple Choice)
4.8/5 (41)
A term that means the same as the term "variable" in an ANOVA procedure is
(Multiple Choice)
4.8/5 (34)
Filters
- Essay(0)
- Multiple Choice(0)
- Short Answer(0)
- True False(0)
- Matching(0)