Exam 10: Inference About Means and Proportions With Two Populations
Exam 1: Data and Statistics98 Questions
Exam 2: Descriptive Statistics: Tabular and Graphical Displays62 Questions
Exam 3: Descriptive Statistics: Numerical Measures173 Questions
Exam 4: Introduction to Probability138 Questions
Exam 5: Discrete Probability Distributions123 Questions
Exam 6: Continuous Probability Distributions174 Questions
Exam 7: Sampling and Sampling Distributions133 Questions
Exam 8: Interval Estimation137 Questions
Exam 9: Hypothesis Tests148 Questions
Exam 10: Inference About Means and Proportions With Two Populations121 Questions
Exam 11: Inferences About Population Variances90 Questions
Exam 12: Comparing Multiple Proportions, Test of Independence and Goodness of Fit90 Questions
Exam 13: Experimental Design and Analysis of Variance115 Questions
Exam 14: Simple Linear Regression146 Questions
Exam 15: Multiple Regression115 Questions
Exam 16: Regression Analysis: Model Building76 Questions
Exam 17: Time Series Analysis and Forecasting68 Questions
Exam 18: Nonparametric Methods81 Questions
Exam 19: Statistical Methods for Quality Control29 Questions
Exam 20: Index Numbers52 Questions
Exam 21: Decision Analysis on Website65 Questions
Exam 22: Sample Survey on Website63 Questions
Select questions type
The business manager of a local health clinic is interested in estimating the difference between the fees for extended office visits in her center and the fees of a newly opened group practice. She gathered the following information regarding the two offices. 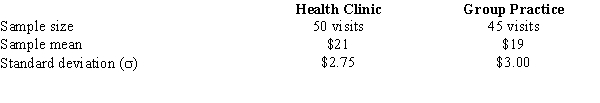 Develop a 95% confidence interval estimate for the difference between the average fees of the two offices.
(Short Answer)
4.8/5  (40)
(40)
Exhibit 10-2
The following information was obtained from matched samples.
The daily production rates for a sample of workers before and after a training program are shown below. 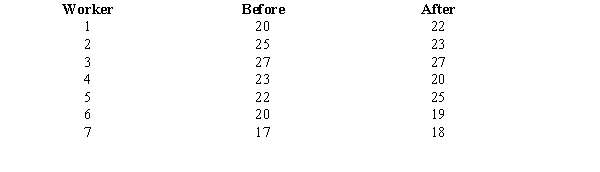 -Refer to Exhibit 10-2. The point estimate for the difference between the means of the two populations is
(Multiple Choice)
4.8/5 (42)
Exhibit 10-3
A statistics teacher wants to see if there is any difference in the abilities of students enrolled in statistics today and those enrolled five years ago. A sample of final examination scores from students enrolled today and from students enrolled five years ago was taken. You are given the following information.  -Refer to Exhibit 10-3. The point estimate for the difference between the means of the two populations is
(Multiple Choice)
4.8/5 (38)
Exhibit 10-1
Salary information regarding male and female employees of a large company is shown below. 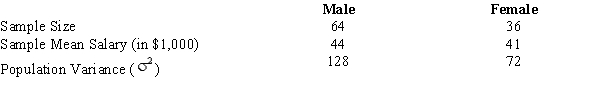 -Refer to Exhibit 10-1. The p-value is
(Multiple Choice)
4.8/5 (28)
When developing an interval estimate for the difference between two sample means, with sample sizes of n1 and n2,
(Multiple Choice)
4.7/5 (32)
Allied Corporation is trying to determine whether to purchase Machine A or B. It has leased the two machines for a month. A random sample of 5 employees has been taken. These employees have gone through a training session on both machines. Below you are given information on their productivity rate on both machines. (Let the difference d = Machine A - Machine B.)  a.State the null and alternative hypotheses for a two-tailed test.
b.Find the mean and standard deviation for the difference.
c.Compute the test statistic.
d.Test the null hypothesis stated in Part a at the 10% level.
a.State the null and alternative hypotheses for a two-tailed test.
b.Find the mean and standard deviation for the difference.
c.Compute the test statistic.
d.Test the null hypothesis stated in Part a at the 10% level.
(Essay)
4.9/5 (29)
Exhibit 10-10
The results of a recent poll on the preference of shoppers regarding two products are shown below.  -Refer to Exhibit 10-10. The 95% confidence interval estimate for the difference between the populations favoring the products is
(Multiple Choice)
4.8/5 (31)
Exhibit 10-9
Two major automobile manufacturers have produced compact cars with the same size engines. We are interested in determining whether or not there is a significant difference in the MPG (miles per gallon) of the two brands of automobiles. A random sample of eight cars from each manufacturer is selected, and eight drivers are selected to drive each automobile for a specified distance. The following data show the results of the test. 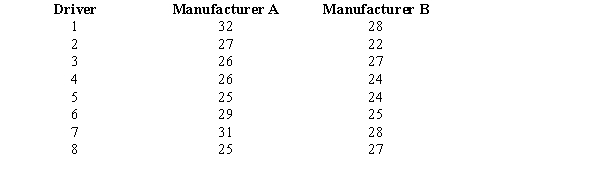 -Refer to Exhibit 10-9. The mean for the differences is
(Multiple Choice)
4.7/5 (40)
Consider the following hypothesis test:
1 - 2 0
1 - 2 > 0
The following results are for two independent samples taken from two populations. 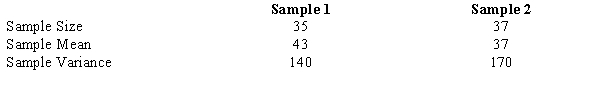 a.Determine the degrees of freedom for the t distribution.
b.Compute the test statistic.
c.Determine the p-value and test the above hypotheses.
a.Determine the degrees of freedom for the t distribution.
b.Compute the test statistic.
c.Determine the p-value and test the above hypotheses.
(Essay)
4.9/5 (39)
Consider the following results for two samples randomly taken from two populations. 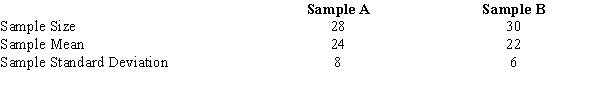 a.Determine the degrees of freedom for the t distribution.
b.Develop a 95% confidence interval for the difference between the two population means.
c.Is there conclusive evidence that one population has a larger mean? Explain.
a.Determine the degrees of freedom for the t distribution.
b.Develop a 95% confidence interval for the difference between the two population means.
c.Is there conclusive evidence that one population has a larger mean? Explain.
(Essay)
4.8/5 (35)
Consider the following results for two samples randomly taken from two populations. 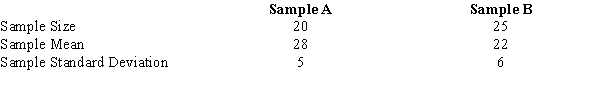 a.Determine the degrees of freedom for the t distribution.
b.At 95% confidence, what is the margin of error?
c.Develop a 95% confidence interval for the difference between the two population means.
a.Determine the degrees of freedom for the t distribution.
b.At 95% confidence, what is the margin of error?
c.Develop a 95% confidence interval for the difference between the two population means.
(Short Answer)
4.7/5 (37)
In order to estimate the difference between the average mortgages in the southern and the northern states of the United States, the following information was gathered. 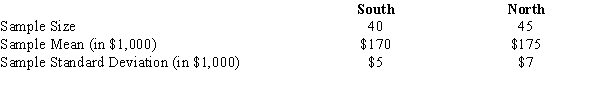 a.Compute the degrees of freedom for the t distribution.
b.Develop an interval estimate for the difference between the average of the mortgages in the South and North. Let Alpha = 0.03.
a.Compute the degrees of freedom for the t distribution.
b.Develop an interval estimate for the difference between the average of the mortgages in the South and North. Let Alpha = 0.03.
(Short Answer)
4.8/5 (37)
Exhibit 10-8
In order to determine whether or not there is a significant difference between the hourly wages of two companies, the following data have been accumulated. 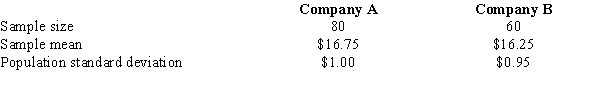 -Refer to Exhibit 10-8. The null hypothesis
(Multiple Choice)
4.9/5 (34)
Exhibit 10-6
The management of a department store is interested in estimating the difference between the mean credit purchases of customers using the store's credit card versus those customers using a national major credit card. You are given the following information. 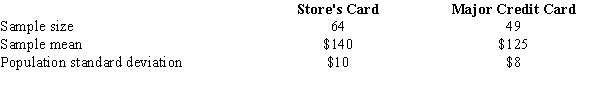 -Refer to Exhibit 10-6. A 95% confidence interval estimate for the difference between the average purchases of the customers using the two different credit cards is
(Multiple Choice)
4.8/5 (40)
The following information regarding the ages of full-time and part-time students are given. Using the following data, develop an interval estimate for the difference between the mean ages of the two populations. Use a 5% level of significance. The degrees of freedom for the t distribution is 106. 
(Short Answer)
4.9/5 (27)
During the recent primary elections, the democratic presidential candidate showed the following pre-election voter support in Alabama and Mississippi.  a.We want to determine whether or not the proportions of voters favoring the Democratic candidate were the same in both states. Provide the hypotheses.
b.Compute the test statistic.
c.Determine the p-value; and at 95% confidence, test the above hypotheses.
a.We want to determine whether or not the proportions of voters favoring the Democratic candidate were the same in both states. Provide the hypotheses.
b.Compute the test statistic.
c.Determine the p-value; and at 95% confidence, test the above hypotheses.
(Essay)
4.9/5 (33)
Exhibit 10-1
Salary information regarding male and female employees of a large company is shown below.
-Refer to Exhibit 10-1. The point estimate of the difference between the means of the two populations is
(Multiple Choice)
4.7/5 (35)
Exhibit 10-1
Salary information regarding male and female employees of a large company is shown below.
-Refer to Exhibit 10-1. At 95% confidence, the margin of error is
(Multiple Choice)
4.7/5 (34)
Exhibit 10-1
Salary information regarding male and female employees of a large company is shown below.
-Refer to Exhibit 10-1. At 95% confidence, the conclusion is the
(Multiple Choice)
4.8/5 (38)
In order to improve the grades of students at UTC, several incentive programs have been introduced. Results of random samples of grades from after and before the incentive programs are given below. 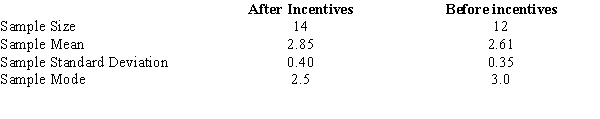 a.Give the hypotheses.
b.Compute the test statistic.
c.At a 0.1 level of significance, test tto determine whether the incentive programs have significantly increased the average grades.
a.Give the hypotheses.
b.Compute the test statistic.
c.At a 0.1 level of significance, test tto determine whether the incentive programs have significantly increased the average grades.
(Essay)
4.9/5 (36)
Filters
- Essay(0)
- Multiple Choice(0)
- Short Answer(0)
- True False(0)
- Matching(0)