Exam 10: Inference About Means and Proportions With Two Populations
Exam 1: Data and Statistics98 Questions
Exam 2: Descriptive Statistics: Tabular and Graphical Displays62 Questions
Exam 3: Descriptive Statistics: Numerical Measures173 Questions
Exam 4: Introduction to Probability138 Questions
Exam 5: Discrete Probability Distributions123 Questions
Exam 6: Continuous Probability Distributions174 Questions
Exam 7: Sampling and Sampling Distributions133 Questions
Exam 8: Interval Estimation137 Questions
Exam 9: Hypothesis Tests148 Questions
Exam 10: Inference About Means and Proportions With Two Populations121 Questions
Exam 11: Inferences About Population Variances90 Questions
Exam 12: Comparing Multiple Proportions, Test of Independence and Goodness of Fit90 Questions
Exam 13: Experimental Design and Analysis of Variance115 Questions
Exam 14: Simple Linear Regression146 Questions
Exam 15: Multiple Regression115 Questions
Exam 16: Regression Analysis: Model Building76 Questions
Exam 17: Time Series Analysis and Forecasting68 Questions
Exam 18: Nonparametric Methods81 Questions
Exam 19: Statistical Methods for Quality Control29 Questions
Exam 20: Index Numbers52 Questions
Exam 21: Decision Analysis on Website65 Questions
Exam 22: Sample Survey on Website63 Questions
Select questions type
Independent random samples taken at two local malls provided the following information regarding purchases by patrons of the two malls. 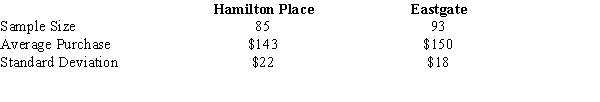 We want to determine whether or not there is a significant difference between the average purchases by the patrons of the two malls.
a.Give the hypotheses for the above.
b.Compute the test statistic.
c.At 95% confidence, test the hypotheses.
We want to determine whether or not there is a significant difference between the average purchases by the patrons of the two malls.
a.Give the hypotheses for the above.
b.Compute the test statistic.
c.At 95% confidence, test the hypotheses.
(Essay)
4.7/5  (24)
(24)
Exhibit 10-4
The following information was obtained from independent random samples.
Assume normally distributed populations with equal variances.  -Refer to Exhibit 10-4. The degrees of freedom for the t-distribution are
(Multiple Choice)
4.8/5 (33)
The results of a recent poll on the preference of voters regarding the presidential candidates are shown below. 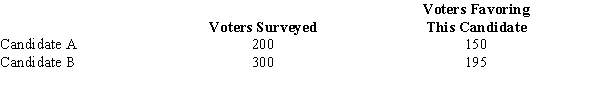 a.Develop a 90% confidence interval estimate for the difference between the proportion of voters favoring each candidate.
b.Does your confidence interval provide conclusive evidence that one of the candidates is favored more? Explain.
a.Develop a 90% confidence interval estimate for the difference between the proportion of voters favoring each candidate.
b.Does your confidence interval provide conclusive evidence that one of the candidates is favored more? Explain.
(Essay)
4.9/5 (30)
Of 300 female registered voters surveyed, 120 indicated they were planning to vote for the incumbent president; while of 400 male registered voters, 140 indicated they were planning to vote for the incumbent president.
a.Compute the test statistic.
b.At alpha = .05, test to see if there is a significant difference between the proportions of females and males who plan to vote for the incumbent president. (Use the p-value approach.)
(Essay)
4.8/5 (36)
Exhibit 10-5
The following information was obtained from matched samples.  -Refer to Exhibit 10-5. If the null hypothesis is tested at the 5% level, the null hypothesis
(Multiple Choice)
4.8/5 (27)
If two independent large samples are taken from two populations, the sampling distribution of the difference between the two sample means
(Multiple Choice)
4.8/5 (36)
Exhibit 10-8
In order to determine whether or not there is a significant difference between the hourly wages of two companies, the following data have been accumulated. 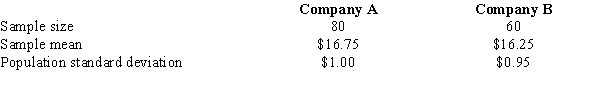 -Refer to Exhibit 10-8. The test statistic is
(Multiple Choice)
4.8/5 (33)
Exhibit 10-2
The following information was obtained from matched samples.
The daily production rates for a sample of workers before and after a training program are shown below. 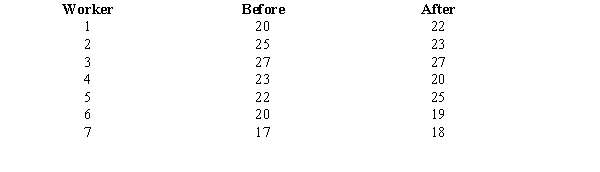 -Refer to Exhibit 10-2. Based on the results of question 18, the
(Multiple Choice)
4.9/5 (38)
In a sample of 100 Republicans, 60 favored the President's anti-drug program. While in a sample of 150 Democrats, 84 favored his program. At 95% confidence, test to see if there is a significant difference in the proportions of the Democrats and the Republicans who favored the President's anti-drug program.
(Essay)
4.7/5 (36)
Exhibit 10-3
A statistics teacher wants to see if there is any difference in the abilities of students enrolled in statistics today and those enrolled five years ago. A sample of final examination scores from students enrolled today and from students enrolled five years ago was taken. You are given the following information.  -Refer to Exhibit 10-3. The 95% confidence interval for the difference between the two population means is
(Multiple Choice)
4.8/5 (45)
Exhibit 10-3
A statistics teacher wants to see if there is any difference in the abilities of students enrolled in statistics today and those enrolled five years ago. A sample of final examination scores from students enrolled today and from students enrolled five years ago was taken. You are given the following information.
-Refer to Exhibit 10-3. The p-value for the difference between the two population means is
(Multiple Choice)
4.9/5 (20)
Exhibit 10-4
The following information was obtained from independent random samples.
Assume normally distributed populations with equal variances.
-Refer to Exhibit 10-4. The 95% confidence interval for the difference between the two population means is
(Multiple Choice)
4.8/5 (30)
Exhibit 10-11
An insurance company selected samples of clients under 18 years of age and over 18 and recorded the number of accidents they had in the previous year. The results are shown below.  We are interested in determining if the accident proportions differ between the two age groups.
-Refer to Exhibit 10-11. The test statistic is
We are interested in determining if the accident proportions differ between the two age groups.
-Refer to Exhibit 10-11. The test statistic is
(Multiple Choice)
4.9/5 (21)
In order to estimate the difference between the average age of male and female employees at the Young Corporation, the following information was gathered. 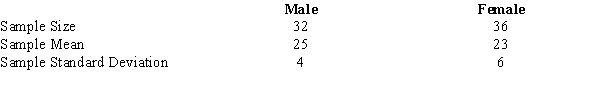 Develop a 95% confidence interval estimate for the difference between the average age of male and female employees at the Young Corporation.
(Short Answer)
4.8/5 (32)
A recent Time magazine reported the following information about a sample of workers in Germany and the United States. 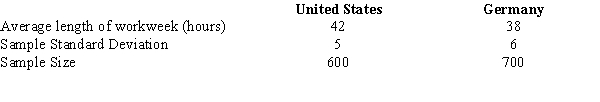 We want to determine whether or not there is a significant difference between the average workweek in the United States and the average workweek in Germany.
a.State the null and the alternative hypotheses.
b.Compute the test statistic.
c.Compute the p-value. What is your conclusion?
We want to determine whether or not there is a significant difference between the average workweek in the United States and the average workweek in Germany.
a.State the null and the alternative hypotheses.
b.Compute the test statistic.
c.Compute the p-value. What is your conclusion?
(Essay)
4.7/5 (36)
The following information was obtained from matched samples regarding the productivity of four individuals using two different methods of production.  Let d = Method 1 - Method 2. Is there a significant difference between the productivity of the two methods? Let = 0.05.
(Essay)
4.9/5 (39)
Exhibit 10-5
The following information was obtained from matched samples.
-Refer to Exhibit 10-5. The point estimate for the difference between the means of the two populations (Method 1 - Method 2) is
(Multiple Choice)
4.7/5 (40)
The following data present the number of computer units sold per day by a sample of 6 salespersons before and after a bonus plan was implemented. 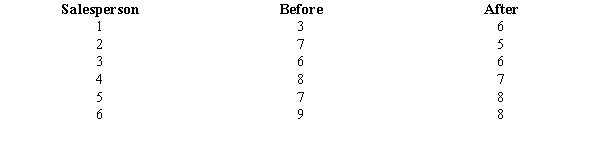 At 95% confidence, test to see if the bonus plan was effective. That is, did the bonus plan actually increase sales? Let d = Before - After.
(Essay)
5.0/5 (40)
In order to estimate the difference between the yearly incomes of marketing managers in the East and West of the United States, the following information was gathered. 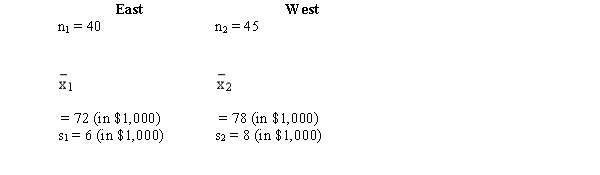 a.Develop an interval estimate for the difference between the average yearly incomes of the marketing managers in the East and West. Use = 0.05.
b.At 95% confidence, use the p-value approach and test to determine if the average yearly income of marketing managers in the East is significantly different from the West.
a.Develop an interval estimate for the difference between the average yearly incomes of the marketing managers in the East and West. Use = 0.05.
b.At 95% confidence, use the p-value approach and test to determine if the average yearly income of marketing managers in the East is significantly different from the West.
(Essay)
4.8/5 (34)
Independent simple random samples are taken to test the difference between the means of two populations whose standard deviations are not known, but are assumed to be equal. The sample sizes are n1 = 25 and n2 = 35. The correct distribution to use is the
(Multiple Choice)
4.9/5 (30)
Filters
- Essay(0)
- Multiple Choice(0)
- Short Answer(0)
- True False(0)
- Matching(0)