Exam 7: Sampling and Sampling Distributions
Exam 1: Data and Statistics98 Questions
Exam 2: Descriptive Statistics: Tabular and Graphical Displays62 Questions
Exam 3: Descriptive Statistics: Numerical Measures173 Questions
Exam 4: Introduction to Probability138 Questions
Exam 5: Discrete Probability Distributions123 Questions
Exam 6: Continuous Probability Distributions174 Questions
Exam 7: Sampling and Sampling Distributions133 Questions
Exam 8: Interval Estimation137 Questions
Exam 9: Hypothesis Tests148 Questions
Exam 10: Inference About Means and Proportions With Two Populations121 Questions
Exam 11: Inferences About Population Variances90 Questions
Exam 12: Comparing Multiple Proportions, Test of Independence and Goodness of Fit90 Questions
Exam 13: Experimental Design and Analysis of Variance115 Questions
Exam 14: Simple Linear Regression146 Questions
Exam 15: Multiple Regression115 Questions
Exam 16: Regression Analysis: Model Building76 Questions
Exam 17: Time Series Analysis and Forecasting68 Questions
Exam 18: Nonparametric Methods81 Questions
Exam 19: Statistical Methods for Quality Control29 Questions
Exam 20: Index Numbers52 Questions
Exam 21: Decision Analysis on Website65 Questions
Exam 22: Sample Survey on Website63 Questions
Select questions type
The following data was collected from a simple random sample of a population. 13 15 14 16 12
The point estimate of the population mean
(Multiple Choice)
4.8/5  (35)
(35)
The probability distribution of all possible values of the sample mean  is
is
(Multiple Choice)
4.9/5 (34)
A department store has determined that 25% of all their sales are credit sales. A random sample of 60 sales is selected.
a.What is the sampling distribution of  ?
b.What is the probability that the sample proportion will be greater than 0.30?
c.What is the probability that the sample proportion will be between 0.20 to 0.30?
?
b.What is the probability that the sample proportion will be greater than 0.30?
c.What is the probability that the sample proportion will be between 0.20 to 0.30?
(Essay)
4.8/5 (31)
Stratified random sampling is a method of selecting a sample in which
(Multiple Choice)
4.8/5 (33)
How many different samples of size 3 can be taken from a finite population of size 10?
(Multiple Choice)
4.8/5 (30)
A simple random sample of 6 recent graduates revealed the following information about their weekly incomes. 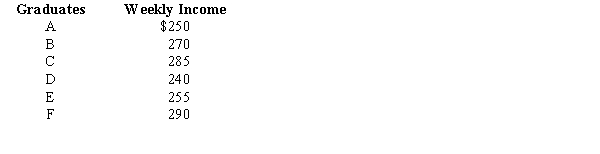 a.What is the expected value of the average weekly income of all the recent graduates?
b.What is the expected value of the standard deviation for the population?
a.What is the expected value of the average weekly income of all the recent graduates?
b.What is the expected value of the standard deviation for the population?
(Short Answer)
4.8/5 (32)
A simple random sample of 100 observations was taken from a large population. The sample mean and the standard deviation were determined to be 80 and 12 respectively. The standard error of the mean is
(Multiple Choice)
4.9/5 (40)
The sample statistic, such as  , s, or
  , that provides the point estimate of the population parameter is known as
(Multiple Choice)
4.8/5 (43)
In computing the standard error of the mean, the finite population correction factor is used when
(Multiple Choice)
4.8/5 (35)
Exhibit 7-2
A random sample of 10 examination papers in a course, which was given on a pass or fail basis, showed the following scores. 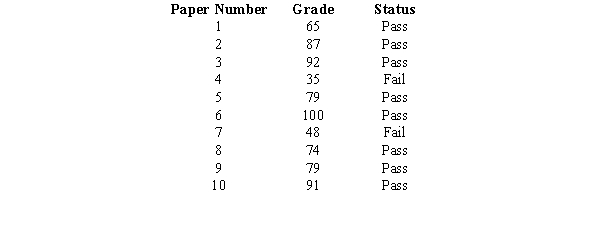 -Refer to Exhibit 7-2. The point estimate for the proportion of all students who passed the course is
(Multiple Choice)
4.7/5 (34)
A subset of a population selected to represent the population is
(Multiple Choice)
4.7/5 (38)
Exhibit 7-1
A random sample of 121 bottles of cologne showed an average content of 4 ounces. It is known that the standard deviation of the contents (i.e., of the population) is 0.22 ounces.
-Refer to Exhibit 7-1. The point estimate of the mean content of the bottles is
(Multiple Choice)
4.7/5 (41)
A sample of 24 observations is taken from a population that has 150 elements. The sampling distribution of  is
is
(Multiple Choice)
4.9/5 (36)
Random samples of size 17 are taken from a population that has 200 elements, a mean of 36, and a standard deviation of 8. The mean and the standard deviation of the sampling distribution of the sample means are
(Multiple Choice)
4.9/5 (28)
The average weekly earnings of bus drivers in a city are $950 (that is ) with a standard deviation of $45 (that is ). Assume that we select a random sample of 81 bus drivers.
a.Compute the standard error of the mean.
b.What is the probability that the sample mean will be greater than $960?
c.If the population of bus drivers consisted of 400 drivers, what would be the standard error of the mean?
(Short Answer)
4.9/5 (26)
Random samples of size 36 are taken from an infinite population whose mean and standard deviation are 20 and 15, respectively. The distribution of the population is unknown. The mean and the standard error of the mean are
(Multiple Choice)
4.9/5 (30)
A random sample of 15 telephone calls in an office showed the duration of each call and whether it was a local or a long distance call. 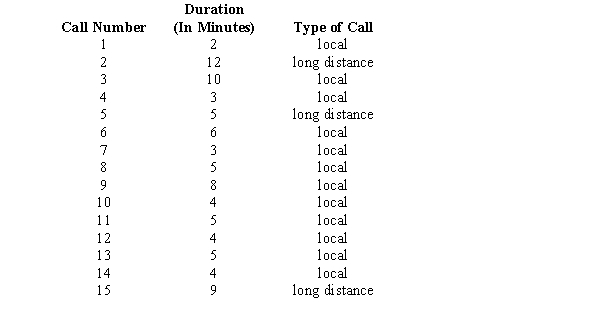 a.What is the point estimate for the average duration of all calls?
b.What is the point estimate for the standard deviation of the population?
c.What is the point estimate for the proportion of all calls that were long distance?
a.What is the point estimate for the average duration of all calls?
b.What is the point estimate for the standard deviation of the population?
c.What is the point estimate for the proportion of all calls that were long distance?
(Short Answer)
4.9/5 (36)
Filters
- Essay(0)
- Multiple Choice(0)
- Short Answer(0)
- True False(0)
- Matching(0)