Exam 7: Sampling and Sampling Distributions
Exam 1: Data and Statistics98 Questions
Exam 2: Descriptive Statistics: Tabular and Graphical Displays62 Questions
Exam 3: Descriptive Statistics: Numerical Measures173 Questions
Exam 4: Introduction to Probability138 Questions
Exam 5: Discrete Probability Distributions123 Questions
Exam 6: Continuous Probability Distributions174 Questions
Exam 7: Sampling and Sampling Distributions133 Questions
Exam 8: Interval Estimation137 Questions
Exam 9: Hypothesis Tests148 Questions
Exam 10: Inference About Means and Proportions With Two Populations121 Questions
Exam 11: Inferences About Population Variances90 Questions
Exam 12: Comparing Multiple Proportions, Test of Independence and Goodness of Fit90 Questions
Exam 13: Experimental Design and Analysis of Variance115 Questions
Exam 14: Simple Linear Regression146 Questions
Exam 15: Multiple Regression115 Questions
Exam 16: Regression Analysis: Model Building76 Questions
Exam 17: Time Series Analysis and Forecasting68 Questions
Exam 18: Nonparametric Methods81 Questions
Exam 19: Statistical Methods for Quality Control29 Questions
Exam 20: Index Numbers52 Questions
Exam 21: Decision Analysis on Website65 Questions
Exam 22: Sample Survey on Website63 Questions
Select questions type
If we consider the simple random sampling process as an experiment, the sample mean is
(Multiple Choice)
4.8/5  (40)
(40)
The following information gives the number of days absent from work for a population of 5 workers at a small factory.  a.Find the mean and the standard deviation for the population.
b.Samples of size 2 will be drawn from the population. Use the answers in part a to calculate the expected value and the standard deviation of the sampling distribution of the sample mean.
c.Find all the samples of 2 workers that can be extracted from this population. Choose the samples without replacement.
d.Compute the sample mean
a.Find the mean and the standard deviation for the population.
b.Samples of size 2 will be drawn from the population. Use the answers in part a to calculate the expected value and the standard deviation of the sampling distribution of the sample mean.
c.Find all the samples of 2 workers that can be extracted from this population. Choose the samples without replacement.
d.Compute the sample mean  for each of the samples in Part c.
(Essay)
4.9/5 (29)
The fact that the sampling distribution of sample means can be approximated by a normal probability distribution whenever the sample size is large is based on the
(Multiple Choice)
4.9/5 (37)
The number of random samples (without replacement) of size 3 that can be drawn from a population of size 5 is
(Multiple Choice)
4.8/5 (31)
From a population of 500 elements, a sample of 225 elements is selected. It is known that the variance of the population is 900. The standard error of the mean is approximately
(Multiple Choice)
4.8/5 (34)
Four hundred people were asked whether gun laws should be more stringent. Three hundred said "yes," and 100 said "no." The point estimate of the proportion in the population who will respond "no" is
(Multiple Choice)
4.9/5 (37)
A simple random sample of 8 employees of a corporation provided the following information.  a.Determine the point estimate for the average age of all employees.
b.What is the point estimate for the standard deviation of the population?
c.Determine a point estimate for the proportion of all employees who are female.
a.Determine the point estimate for the average age of all employees.
b.What is the point estimate for the standard deviation of the population?
c.Determine a point estimate for the proportion of all employees who are female.
(Short Answer)
4.8/5 (38)
A finite population correction factor is needed in computing the standard deviation of the sampling distribution of sample means
(Multiple Choice)
4.8/5 (31)
Exhibit 7-1
A random sample of 121 bottles of cologne showed an average content of 4 ounces. It is known that the standard deviation of the contents (i.e., of the population) is 0.22 ounces.
-Refer to Exhibit 7-1. The standard error of the mean equals
(Multiple Choice)
4.8/5 (35)
An experimental diet to induce weight loss was followed for one week by a randomly selected group of 12 students with the following results. 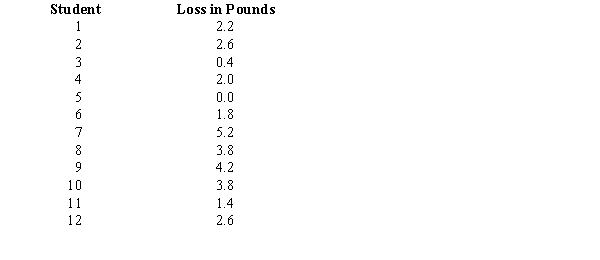 a.Find a point estimate for the average amount lost after one week on this diet. Is this an unbiased estimate of the population mean? Explain.
b.Find a point estimate for the variance of the amount lost on this diet. Is this an unbiased estimate of the population variance? Explain.
c.Find a point estimate for the standard deviation of the amount lost on this diet.
a.Find a point estimate for the average amount lost after one week on this diet. Is this an unbiased estimate of the population mean? Explain.
b.Find a point estimate for the variance of the amount lost on this diet. Is this an unbiased estimate of the population variance? Explain.
c.Find a point estimate for the standard deviation of the amount lost on this diet.
(Essay)
4.8/5 (32)
Whenever the population has a normal probability distribution, the sampling distribution of  is a normal probability distribution for
(Multiple Choice)
4.9/5 (31)
Random samples of size 81 are taken from an infinite population whose mean and standard deviation are 200 and 18, respectively. The distribution of the population is unknown. The mean and the standard error of the mean are
(Multiple Choice)
4.8/5 (34)
A population has a mean of 300 and a standard deviation of 18. A sample of 144 observations will be taken. The probability that the sample mean will be between 297 to 303 is
(Multiple Choice)
4.7/5 (35)
A population has a mean of 80 and a standard deviation of 7. A sample of 49 observations will be taken. The probability that the sample mean will be larger than 82 is
(Multiple Choice)
4.9/5 (40)
There are 6 children in a family. The number of children defines a population. The number of simple random samples of size 2 (without replacement) which are possible equals
(Multiple Choice)
4.8/5 (26)
Exhibit 7-3
In a local university, 40% of the students live in the dormitories. A random sample of 80 students is selected for a particular study.
-Refer to Exhibit 7-3. The probability that the sample proportion (the proportion living in the dormitories) is at least 0.30 is
(Multiple Choice)
4.9/5 (39)
Filters
- Essay(0)
- Multiple Choice(0)
- Short Answer(0)
- True False(0)
- Matching(0)