Exam 2: Descriptive Statistics: Tabular and Graphical Displays
Exam 1: Data and Statistics98 Questions
Exam 2: Descriptive Statistics: Tabular and Graphical Displays62 Questions
Exam 3: Descriptive Statistics: Numerical Measures173 Questions
Exam 4: Introduction to Probability138 Questions
Exam 5: Discrete Probability Distributions123 Questions
Exam 6: Continuous Probability Distributions174 Questions
Exam 7: Sampling and Sampling Distributions133 Questions
Exam 8: Interval Estimation137 Questions
Exam 9: Hypothesis Tests148 Questions
Exam 10: Inference About Means and Proportions With Two Populations121 Questions
Exam 11: Inferences About Population Variances90 Questions
Exam 12: Comparing Multiple Proportions, Test of Independence and Goodness of Fit90 Questions
Exam 13: Experimental Design and Analysis of Variance115 Questions
Exam 14: Simple Linear Regression146 Questions
Exam 15: Multiple Regression115 Questions
Exam 16: Regression Analysis: Model Building76 Questions
Exam 17: Time Series Analysis and Forecasting68 Questions
Exam 18: Nonparametric Methods81 Questions
Exam 19: Statistical Methods for Quality Control29 Questions
Exam 20: Index Numbers52 Questions
Exam 21: Decision Analysis on Website65 Questions
Exam 22: Sample Survey on Website63 Questions
Select questions type
In a cumulative percent frequency distribution, the last class will have a cumulative percent frequency equal to
(Multiple Choice)
4.9/5  (32)
(32)
There are 800 students in the School of Business Administration. There are four majors in the School: Accounting, Finance, Management, and Marketing. The following shows the number of students in each major.  Develop a percent frequency distribution and construct a bar chart and a pie chart.
(Essay)
4.9/5 (33)
Which of the following is a graphical summary of a set of data in which each data value is represented by a dot above the axis?
(Multiple Choice)
4.9/5 (36)
The most common graphical presentation of quantitative data is a
(Multiple Choice)
4.9/5 (31)
The ACT scores of a sample of business school students and their genders are shown below. 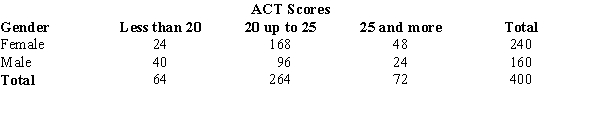 a.How many students scored less than 20?
b.How many students were female?
c.Of the male students, how many scored 25 or more?
d.Compute row percentages and comment on any relationship that may exist between ACT scores and gender of the individuals.
e.Compute column percentages.
a.How many students scored less than 20?
b.How many students were female?
c.Of the male students, how many scored 25 or more?
d.Compute row percentages and comment on any relationship that may exist between ACT scores and gender of the individuals.
e.Compute column percentages.
(Essay)
4.9/5 (40)
A situation in which conclusions based upon aggregated crosstabulation are different from unaggregated crosstabulation is known as
(Multiple Choice)
4.9/5 (35)
The following data set shows the number of hours of sick leave that some of the employees of Bastien's, Inc. have taken during the first quarter of the year (rounded to the nearest hour).  a.Develop a frequency distribution for the above data. (Let the width of your classes be 10 units and start your first class as 10 - 19.)
b.Develop a relative frequency distribution and a percent frequency distribution for the data.
c.Develop a cumulative frequency distribution.
d.How many employees have taken less than 40 hours of sick leave?
a.Develop a frequency distribution for the above data. (Let the width of your classes be 10 units and start your first class as 10 - 19.)
b.Develop a relative frequency distribution and a percent frequency distribution for the data.
c.Develop a cumulative frequency distribution.
d.How many employees have taken less than 40 hours of sick leave?
(Essay)
4.9/5 (27)
Exhibit 2-3
A survey of 800 college seniors resulted in the following crosstabulation regarding their undergraduate major and whether or not they plan to go to graduate school. 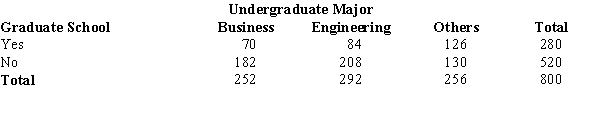 -Refer to Exhibit 2-3. What percentage of the students does not plan to go to graduate school?
(Multiple Choice)
4.9/5 (23)
Below you are given the examination scores of 20 students. 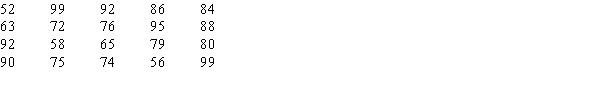 a.Construct a frequency distribution for this data. Let the first class be 50 - 59.
b.Construct a cumulative frequency distribution.
c.Construct a relative frequency distribution.
d.Construct a cumulative relative frequency distribution.
a.Construct a frequency distribution for this data. Let the first class be 50 - 59.
b.Construct a cumulative frequency distribution.
c.Construct a relative frequency distribution.
d.Construct a cumulative relative frequency distribution.
(Essay)
4.9/5 (39)
The frequency distribution below was constructed from data collected on the quarts of soft drinks consumed per week by 20 students. 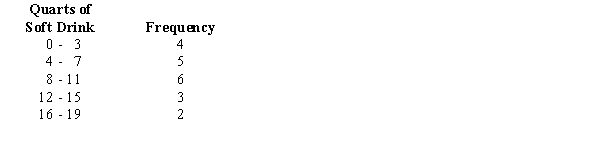 a.Construct a relative frequency distribution.
b.Construct a cumulative frequency distribution.
c.Construct a cumulative relative frequency distribution.
a.Construct a relative frequency distribution.
b.Construct a cumulative frequency distribution.
c.Construct a cumulative relative frequency distribution.
(Essay)
4.9/5 (33)
Exhibit 2-4
Michael's Compute-All, a national computer retailer, has kept a record of the number of laptop computers they have sold for a period of 80 days. Their sales records are shown below: 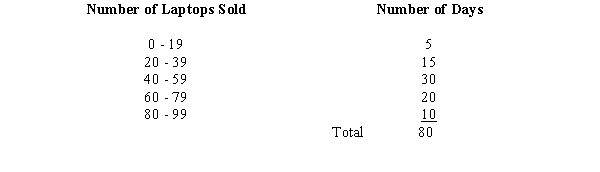 -Refer to Exhibit 2-4. The lower limit of the first class is
(Multiple Choice)
4.8/5 (31)
A graphical presentation of the relationship between two variables is
(Multiple Choice)
4.9/5 (29)
Exhibit 2-4
Michael's Compute-All, a national computer retailer, has kept a record of the number of laptop computers they have sold for a period of 80 days. Their sales records are shown below:
-Refer to Exhibit 2-4. The number of days in which the company sold less than 60 laptops is
(Multiple Choice)
4.8/5 (31)
Forty shoppers were asked if they preferred the weight of a can of soup to be 6 ounces, 8 ounces, or 10 ounces. Below you are given their responses. 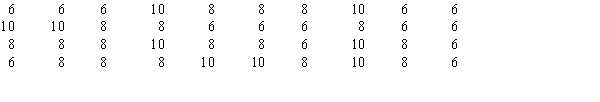 a.Construct a frequency distribution and graphically represent the frequency distribution.
b.Construct a relative frequency distribution and graphically represent the relative frequency distribution.
a.Construct a frequency distribution and graphically represent the frequency distribution.
b.Construct a relative frequency distribution and graphically represent the relative frequency distribution.
(Essay)
4.8/5 (41)
Exhibit 2-4
Michael's Compute-All, a national computer retailer, has kept a record of the number of laptop computers they have sold for a period of 80 days. Their sales records are shown below:
-Refer to Exhibit 2-4. The percentage of days in which the company sold at least 40 laptops is
(Multiple Choice)
4.8/5 (32)
In constructing a frequency distribution, the approximate class width is computed as
(Multiple Choice)
5.0/5 (40)
The reversal of conclusions based on aggregate and unaggregated data is called:
(Multiple Choice)
4.9/5 (33)
Filters
- Essay(0)
- Multiple Choice(0)
- Short Answer(0)
- True False(0)
- Matching(0)