Exam 2: Descriptive Statistics: Tabular and Graphical Displays
Exam 1: Data and Statistics98 Questions
Exam 2: Descriptive Statistics: Tabular and Graphical Displays62 Questions
Exam 3: Descriptive Statistics: Numerical Measures173 Questions
Exam 4: Introduction to Probability138 Questions
Exam 5: Discrete Probability Distributions123 Questions
Exam 6: Continuous Probability Distributions174 Questions
Exam 7: Sampling and Sampling Distributions133 Questions
Exam 8: Interval Estimation137 Questions
Exam 9: Hypothesis Tests148 Questions
Exam 10: Inference About Means and Proportions With Two Populations121 Questions
Exam 11: Inferences About Population Variances90 Questions
Exam 12: Comparing Multiple Proportions, Test of Independence and Goodness of Fit90 Questions
Exam 13: Experimental Design and Analysis of Variance115 Questions
Exam 14: Simple Linear Regression146 Questions
Exam 15: Multiple Regression115 Questions
Exam 16: Regression Analysis: Model Building76 Questions
Exam 17: Time Series Analysis and Forecasting68 Questions
Exam 18: Nonparametric Methods81 Questions
Exam 19: Statistical Methods for Quality Control29 Questions
Exam 20: Index Numbers52 Questions
Exam 21: Decision Analysis on Website65 Questions
Exam 22: Sample Survey on Website63 Questions
Select questions type
A sample of the ages of 10 employees of a company is shown below.  Construct a dot plot for the above data.
(Essay)
4.7/5  (37)
(37)
Exhibit 2-3
A survey of 800 college seniors resulted in the following crosstabulation regarding their undergraduate major and whether or not they plan to go to graduate school. 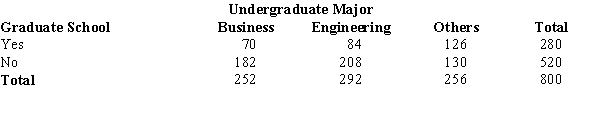 -Refer to Exhibit 2-3. What percentage of the students' undergraduate major is engineering?
(Multiple Choice)
4.8/5 (34)
The frequency distribution below was constructed from data collected from a group of 25 students. 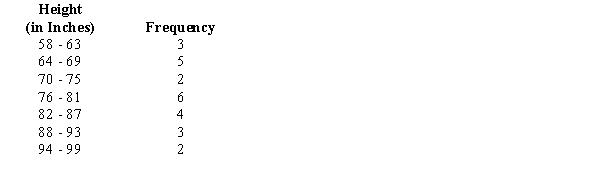 a.Construct a relative frequency distribution.
b.Construct a cumulative frequency distribution.
c.Construct a cumulative relative frequency distribution.
a.Construct a relative frequency distribution.
b.Construct a cumulative frequency distribution.
c.Construct a cumulative relative frequency distribution.
(Essay)
4.8/5 (32)
Exhibit 2-4
Michael's Compute-All, a national computer retailer, has kept a record of the number of laptop computers they have sold for a period of 80 days. Their sales records are shown below: 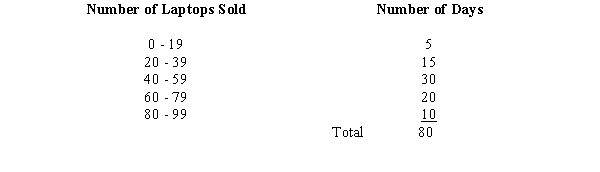 -Refer to Exhibit 2-4. If one develops a cumulative frequency distribution for the above data, the last class will have a frequency of
(Multiple Choice)
4.9/5 (42)
Which of the following graphical methods shows the relationship between two variables?
(Multiple Choice)
4.9/5 (36)
When a histogram has a longer tail to the right, it is said to be
(Multiple Choice)
4.9/5 (36)
If several frequency distributions are constructed from the same data set, the distribution with the widest class width will have the
(Multiple Choice)
4.8/5 (36)
The sum of the relative frequencies for all classes will always equal
(Multiple Choice)
4.7/5 (44)
For the following observations, plot a scatter diagram and indicate what kind of relationship (if any) exist between x and y. 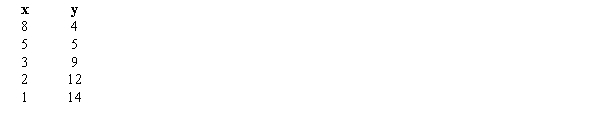
(Essay)
4.8/5 (34)
The following data shows the price of PAO, Inc. stock over the last 8 months. 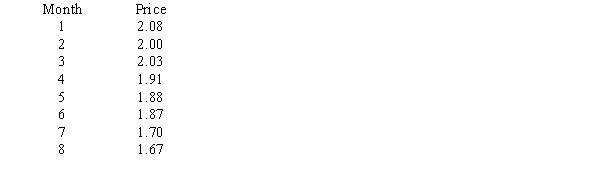 a.Develop a scatter diagram and draw a trend line through the points.
b.What kind of relationship exists between stock price and time (negative, positive, or no relation)?
a.Develop a scatter diagram and draw a trend line through the points.
b.What kind of relationship exists between stock price and time (negative, positive, or no relation)?
(Essay)
4.9/5 (40)
A researcher is gathering data from four geographical areas designated: South = 1; North = 2; East = 3; West = 4. The designated geographical regions represent
(Multiple Choice)
4.9/5 (40)
Data that provide labels or names for categories of like items are known as
(Multiple Choice)
4.9/5 (35)
Thirty students in the School of Business were asked what their majors were. The following represents their responses (M = Management; A = Accounting; E = Economics; O = Others). 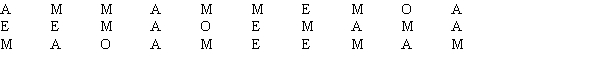 a.Construct a frequency distribution and a bar chart.
b.Construct a relative frequency distribution and a pie chart.
a.Construct a frequency distribution and a bar chart.
b.Construct a relative frequency distribution and a pie chart.
(Essay)
4.8/5 (39)
Exhibit 2-3
A survey of 800 college seniors resulted in the following crosstabulation regarding their undergraduate major and whether or not they plan to go to graduate school.
-Refer to Exhibit 2-3. Among the students who plan to go to graduate school, what percentage indicated "Other" majors?
(Multiple Choice)
4.8/5 (26)
A student has completed 20 courses in the School of Arts and Sciences. Her grades in the 20 courses are shown below. 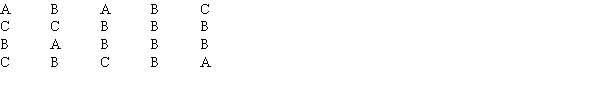 a.Develop a frequency distribution and a bar chart for her grades.
b.Develop a relative frequency distribution for her grades and construct a pie chart.
a.Develop a frequency distribution and a bar chart for her grades.
b.Develop a relative frequency distribution for her grades and construct a pie chart.
(Essay)
4.7/5 (35)
For the following observations, plot a scatter diagram and indicate what kind of relationship (if any) exist between x and y. 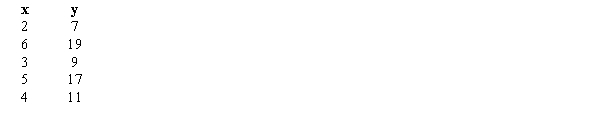
(Essay)
4.8/5 (35)
Filters
- Essay(0)
- Multiple Choice(0)
- Short Answer(0)
- True False(0)
- Matching(0)